

Key Highlights
- Ripple price is trading in a range above the $0.6800 support area against the US Dollar.
- This is a short-term bearish trend line forming with resistance at $0.7400 on the hourly chart of the XRP/USD pair (data source from Kraken).
- The pair might move higher in the near term, but it could face sellers near $0.7400 and the 100 hourly simple moving average.
Ripple price is consolidating against the US Dollar and Bitcoin. XRP/USD has to move above $0.7500 to gain traction in the near term.
Ripple Price Support
After a major upside move, Ripple price started a correction and moved below $0.7000 against the US Dollar. However, the price found support at $0.6800 and later started trading in a range. There were a couple of swing moves and the price recently retested the $0.6600-0.6800 support area. It is currently moving higher and it recently traded above the 23.6% Fib retracement level of the last decline from the $0.8405 high to $0.6777 low.
There are many minor resistances on the upside, including $0.7400 and $0.7500. There is also a short-term bearish trend line forming with resistance at $0.7400 on the hourly chart of the XRP/USD pair. Below the trend line at $0.7500, the 100 hourly simple moving average may also act as a strong resistance. Moreover, the 50% Fib retracement level of the last decline from the $0.8405 high to $0.6777 low is at $0.7600 to stop the upside move.
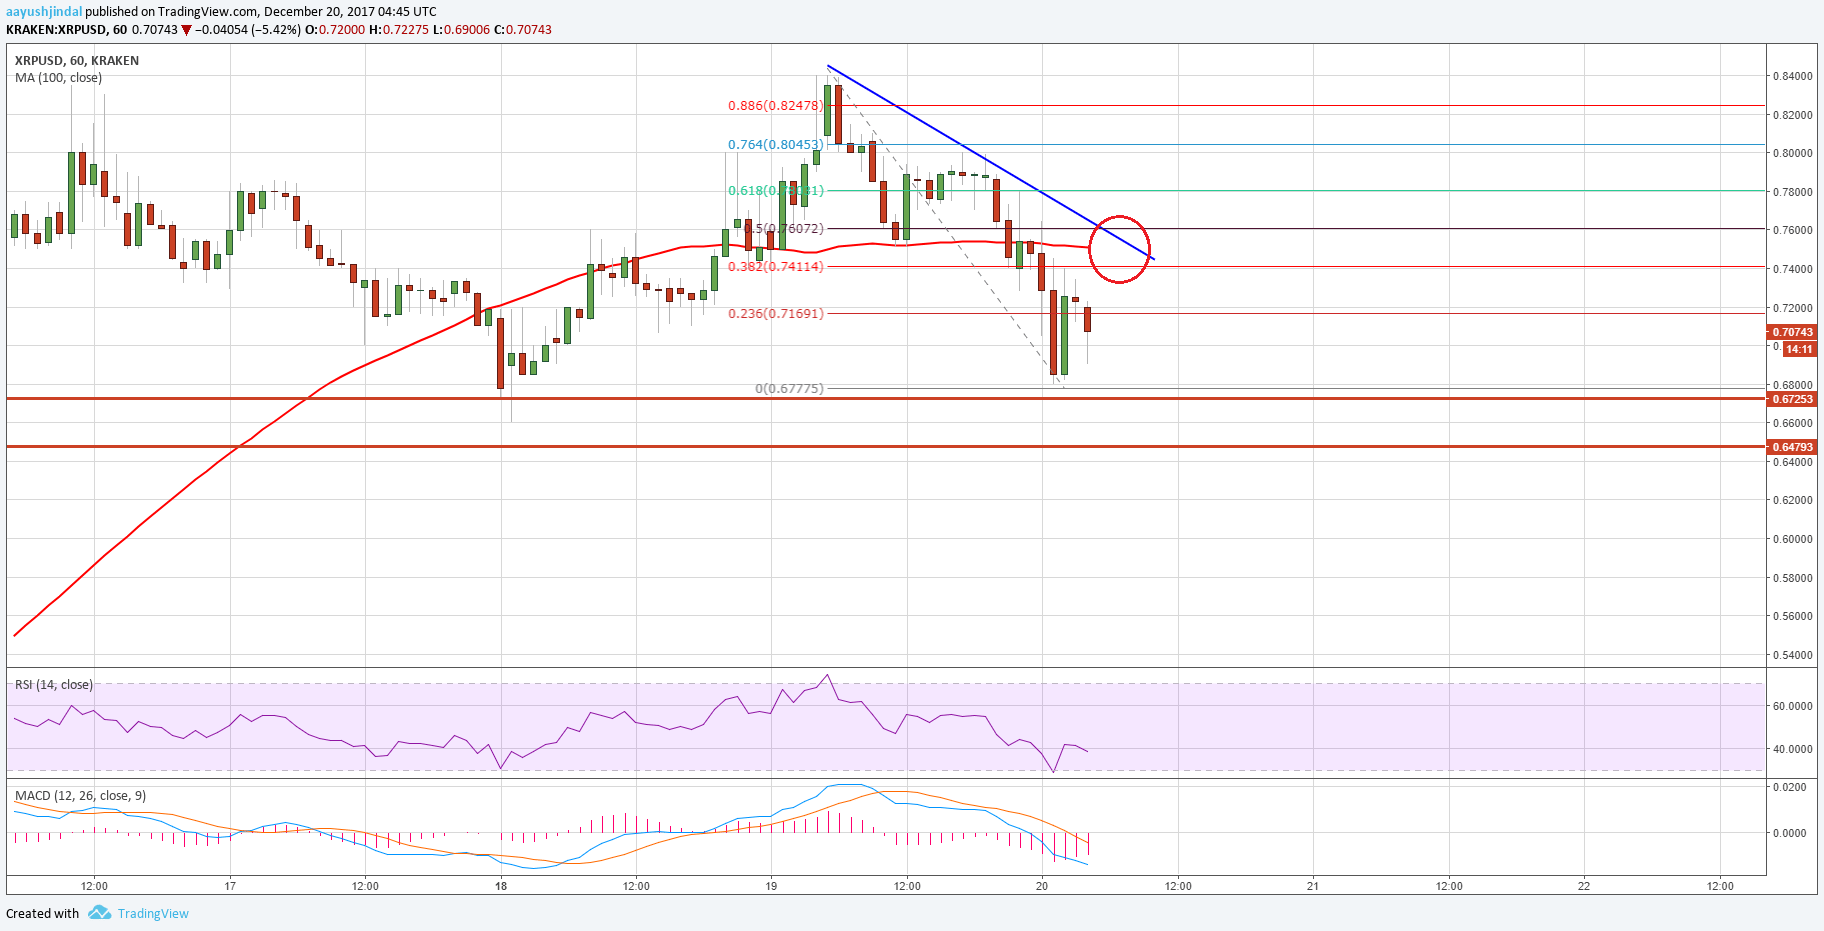
Therefore, it seems like the $0.7400-0.7600 region is a good short-term resistance zone. XRP has to move above the $0.7600 level to move back in the bullish zone. Above $0.7600, the price could trade towards the $0.8400 level in the near term.
Looking at the technical indicators:
Hourly MACD – The MACD for XRP/USD is currently in the bearish zone.
Hourly RSI (Relative Strength Index) – The RSI for XRP/USD is currently well below the 50 level, and is heading lower.
Major Support Level – $0.6800
Major Resistance Level – $0.7600
Charts courtesy – Trading View, Kraken