Key Highlights
- Ripple price formed a nice support around $0.7400 and moved a few points higher against the US dollar.
- There is a major connecting bearish trend line forming with resistance at $0.8300 on the hourly chart of the XRP/USD pair (data source from Kraken).
- The pair must break $0.8300 and $0.8400 resistance for further upsides in the near term.
Ripple price is slowly gaining pace against the US Dollar and Bitcoin. XRP/USD must break the $0.8400 hurdle to set the pace for more gains.
Ripple Price Resistance
After a major decline, there was a strong buying interest noted near $0.7400 in Ripple price against the US Dollar. The price formed a low near $0.7450 and started an upside move. It traded above the $0.7800 and $0.8000 resistance levels. It even broke the $0.8200 level and the 100 hourly simple moving average. However, the upside move was capped by the $0.8310 level.
A fresh downside move is underway and the price broke the 23.6% Fib retracement level of the last wave from the $0.7466 low to $0.8312 high. More importantly, the price is now below the $0.8000 level and the 100 hourly SMA. It may decline further to test the 50% Fib retracement level of the last wave from the $0.7466 low to $0.8312 high. Below $0.7850, the price may even test the $0.7650 level. On the upside, there is a major connecting bearish trend line forming with resistance at $0.8300 on the hourly chart of the XRP/USD pair.
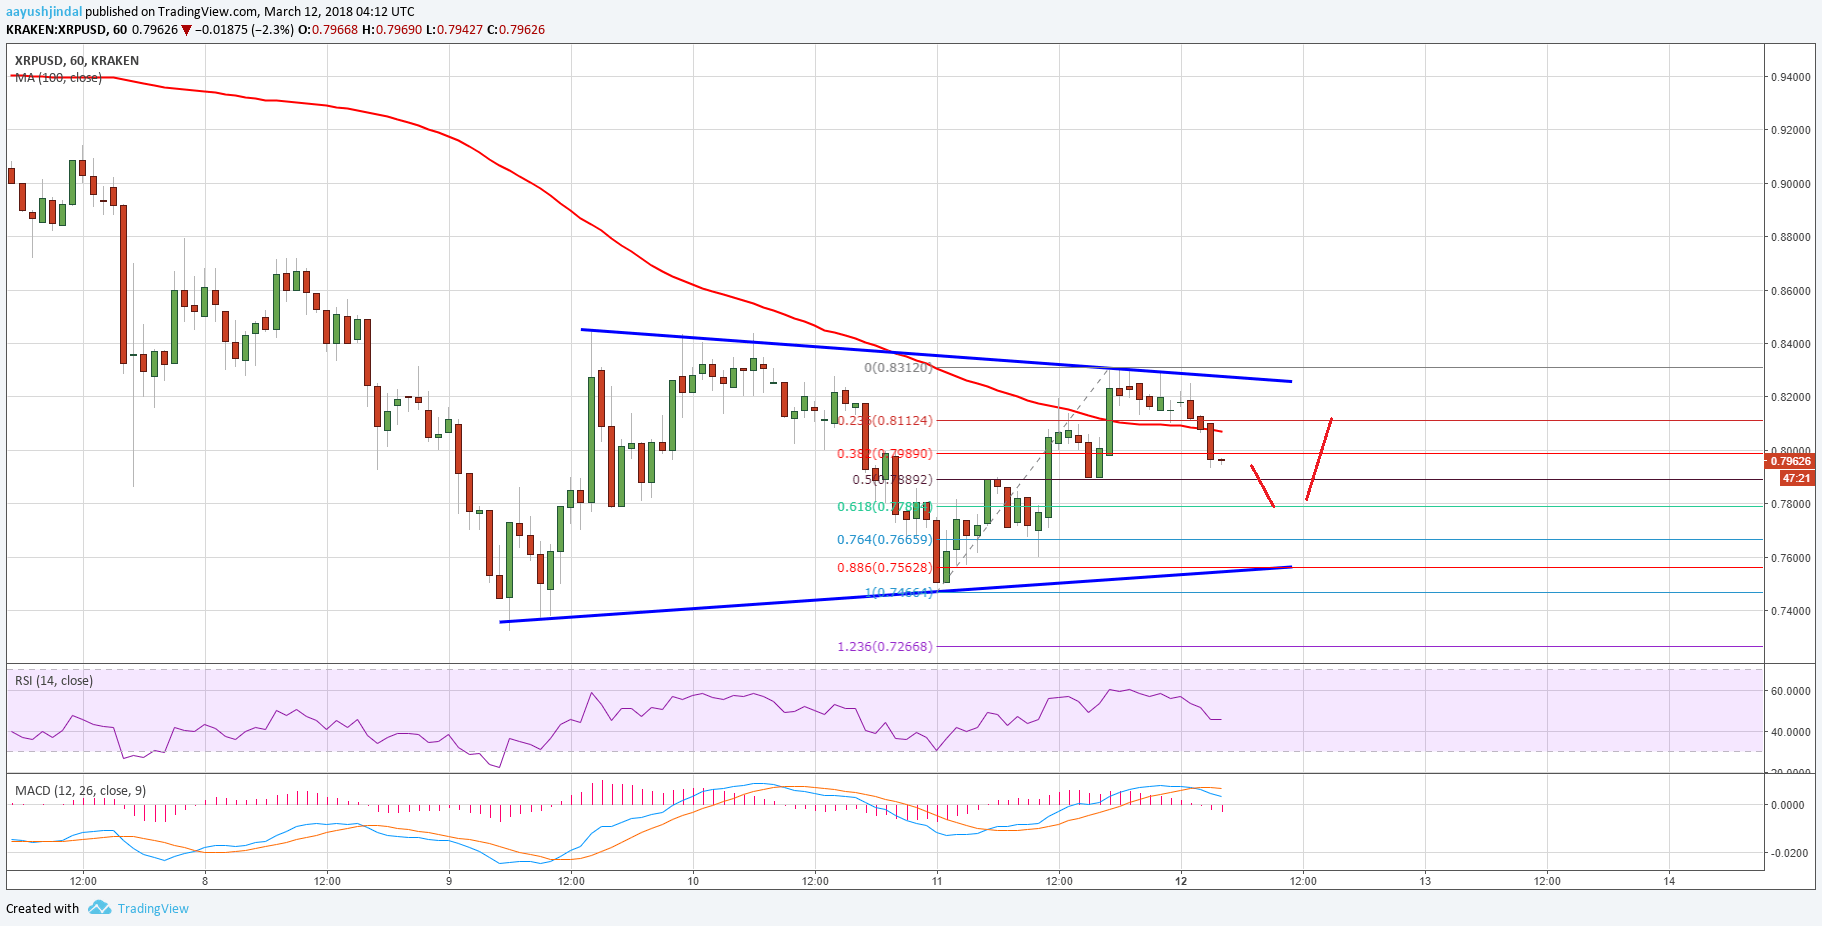

The pair must break the $0.8300 and $0.8400 resistance levels to gain upside momentum. The overall bias is neutral and it seems like the price is consolidating above the $0.7500 level in the short term.
Looking at the technical indicators:
Hourly MACD – The MACD for XRP/USD is slightly moving in the bearish zone.
Hourly RSI (Relative Strength Index) – The RSI for XRP/USD is moving down and is just around 50.
Major Support Level – $0.7650
Major Resistance Level – $0.8400
Charts courtesy – Trading View