Key Highlights
- Ripple price accelerated declined and broke the $0.6000 and $0.5800 support levels against the US dollar.
- There is a short-term bearish trend line forming with resistance at $0.5800 on the hourly chart of the XRP/USD pair (data source from Kraken).
- The pair remains at a risk more losses below the $0.5600 and $0.5500 support levels.
Ripple price is in a bearish trend against the US Dollar and Bitcoin. XRP/USD is struggling to hold ground and it could decline further towards $0.5400.
Ripple Price Bearish Trend
There was no recovery in Ripple price above the $0.6400 and $0.6500 resistance levels against the US Dollar. The price declined further and it broke a major support at $0.6150. It opened the doors for more losses and the price declined below the $0.6000 and $0.5800 support levels. Clearly, the price is in a bearish trend and is currently trading well below the $0.6000 level and the 100 hourly simple moving average.
The recent low was formed at $0.5595 and it seems like the price may even struggle to correct higher. An initial resistance is around the 23.6% Fib retracement level of the last decline from the $0.6561 high to $0.5595 low. There is also a short-term bearish trend line forming with resistance at $0.5800 on the hourly chart of the XRP/USD pair. If buyers succeed in pushing the price above $0.5800, the next resistance is at $0.6000. Moreover, the 50% Fib retracement level of the last decline from the $0.6561 high to $0.5595 low is at $0.6078 to act as the next hurdle.
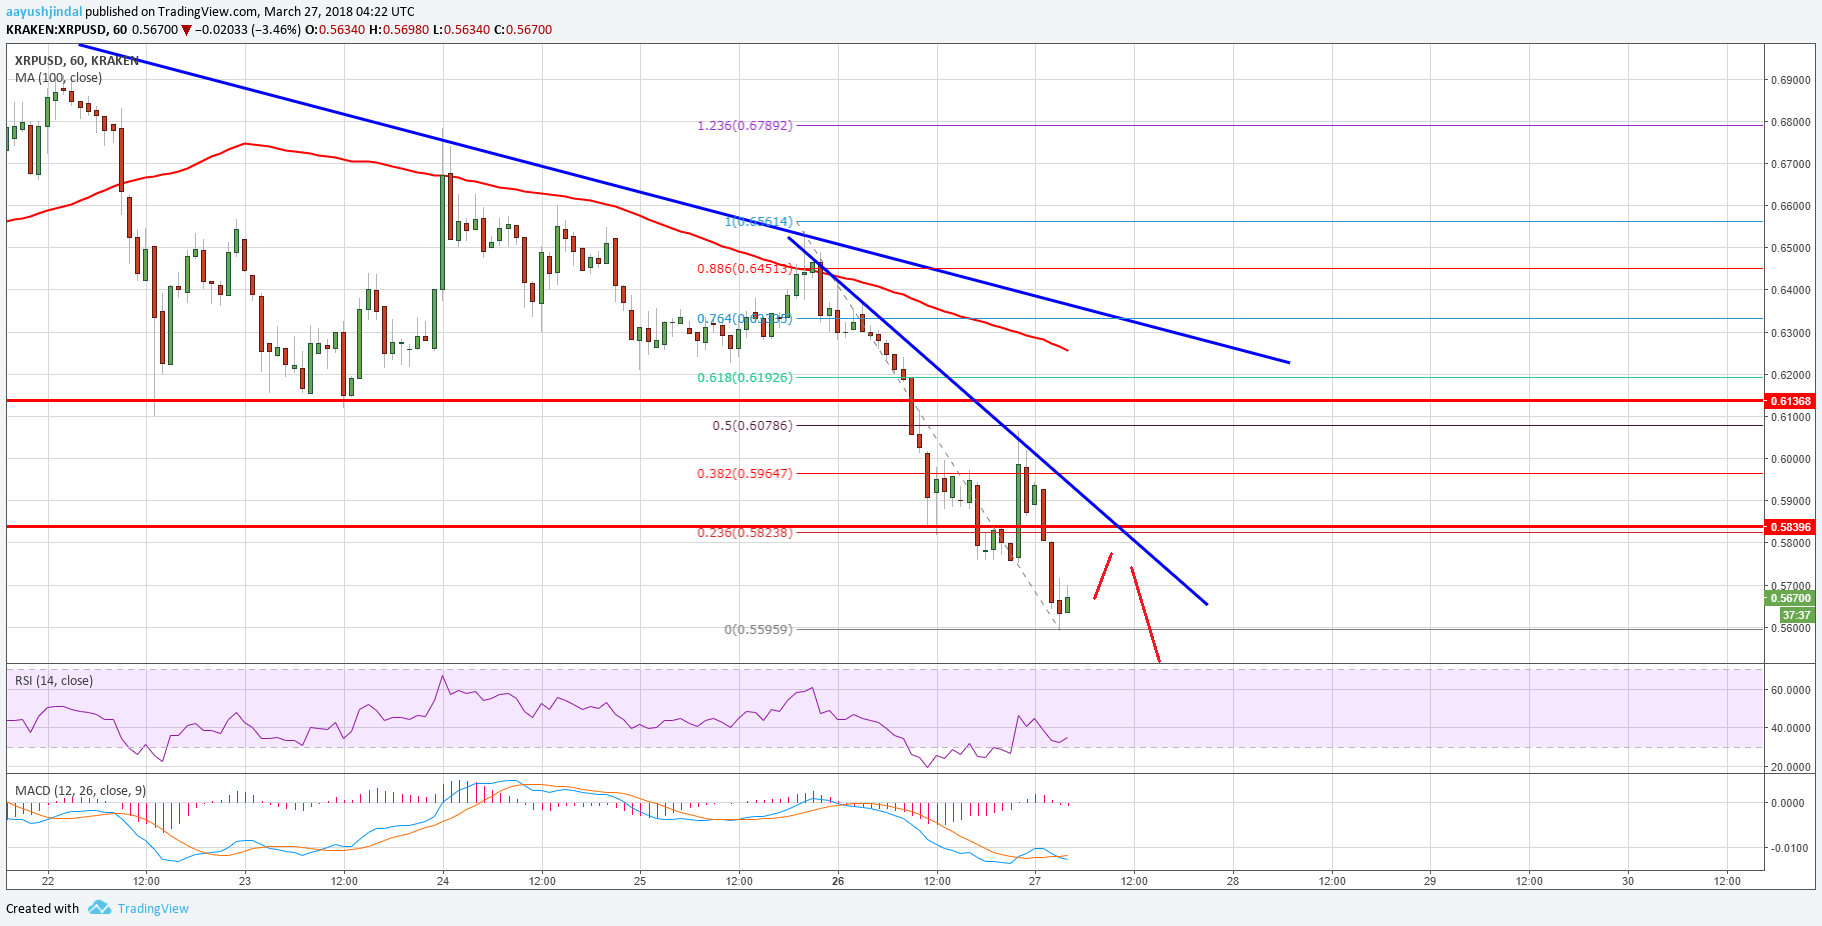

On the downside, the recent low of $0.5595 remains at a risk. A break below $0.5595 may call for more losses below $0.5500 in the near term.
Looking at the technical indicators:
Hourly MACD – The MACD for XRP/USD is placed nicely in the bearish zone.
Hourly RSI (Relative Strength Index) – The RSI for XRP/USD is currently around the 25 level.
Major Support Level – $0.5500
Major Resistance Level – $0.6000
Charts courtesy – Trading View