Key Highlights
- Ripple price fell sharply and declined below the $0.8500 and $0.8200 support levels against the US dollar.
- There is a major bearish trend line forming with resistance near $0.8600 on the hourly chart of the XRP/USD pair (data source from Kraken).
- The pair remains in a bearish zone and it may decline further towards $0.7800 in the near term.
Ripple price fell sharply against the US Dollar and Bitcoin. XRP/USD is now well below $0.8500 and it looks set for more losses in the short term.
Ripple Price Decline
There was a sharp downside reaction from the $0.9200 swing high in Ripple price against the US Dollar. The price declined and broke a major support area near $0.8500. It ignited further declines and the price even traded below the $0.8000 level before recovering. It is now trading well below the $0.9000 resistance and the 100 hourly simple moving average.
Recently, the price traded as low as $0.7877 before it recovered. It moved above the 50% Fib retracement level of the last drop from the $0.9236 high to $0.7877 low. However, the upside move was protected by the $0.8870 level. Moreover, there was close above the 61.8% Fib retracement level of the last drop from the $0.9236 high to $0.7877 low. It seems like the price failed to move above the maintain gains above the $0.8600 level. On the upside, there is a major bearish trend line forming with resistance near $0.8600 on the hourly chart of the XRP/USD pair.
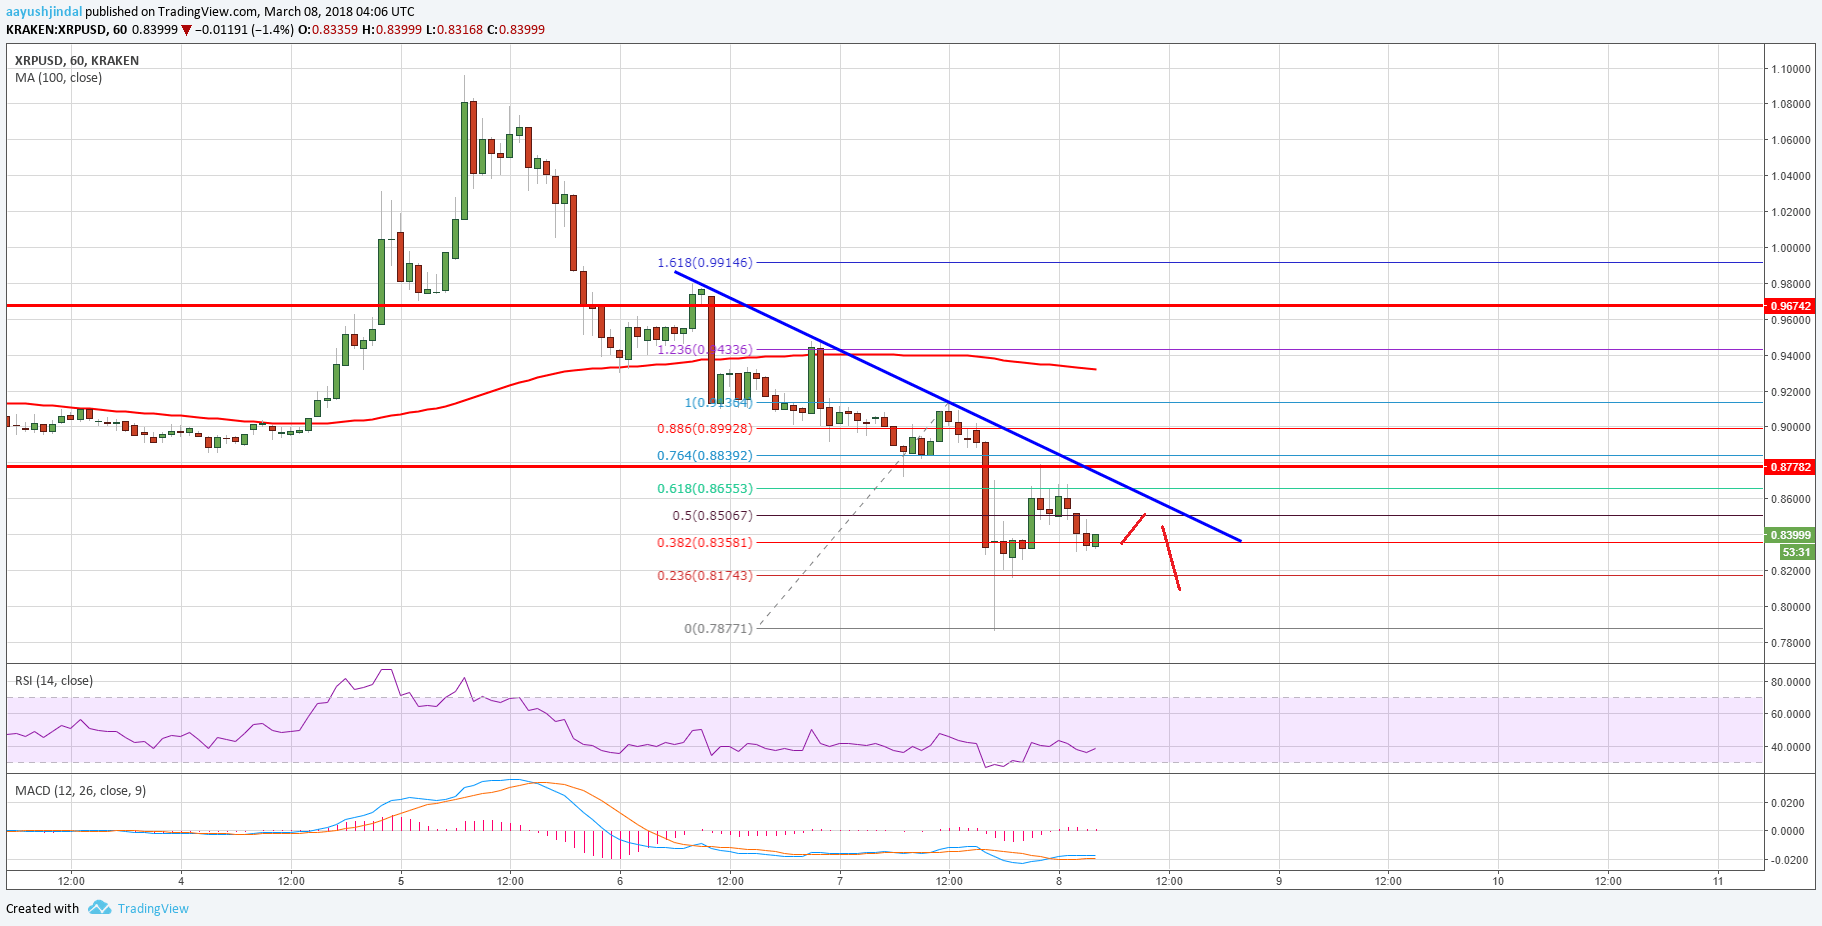

Therefore, a major recovery above $0.8600 won’t be easy. On the downside, the $0.8000 level is a decent support. Below the mentioned $0.8000, the price may retest the $0.7800 level in the near term.
Looking at the technical indicators:
Hourly MACD – The MACD for XRP/USD is slightly in the bullish zone.
Hourly RSI (Relative Strength Index) – The RSI for XRP/USD is currently recovering from the 30 level.
Major Support Level – $0.8000
Major Resistance Level – $0.8600
Charts courtesy – Trading View