Key Highlights
- Ripple price declined below the $0.9500 support area yesterday against the US dollar.
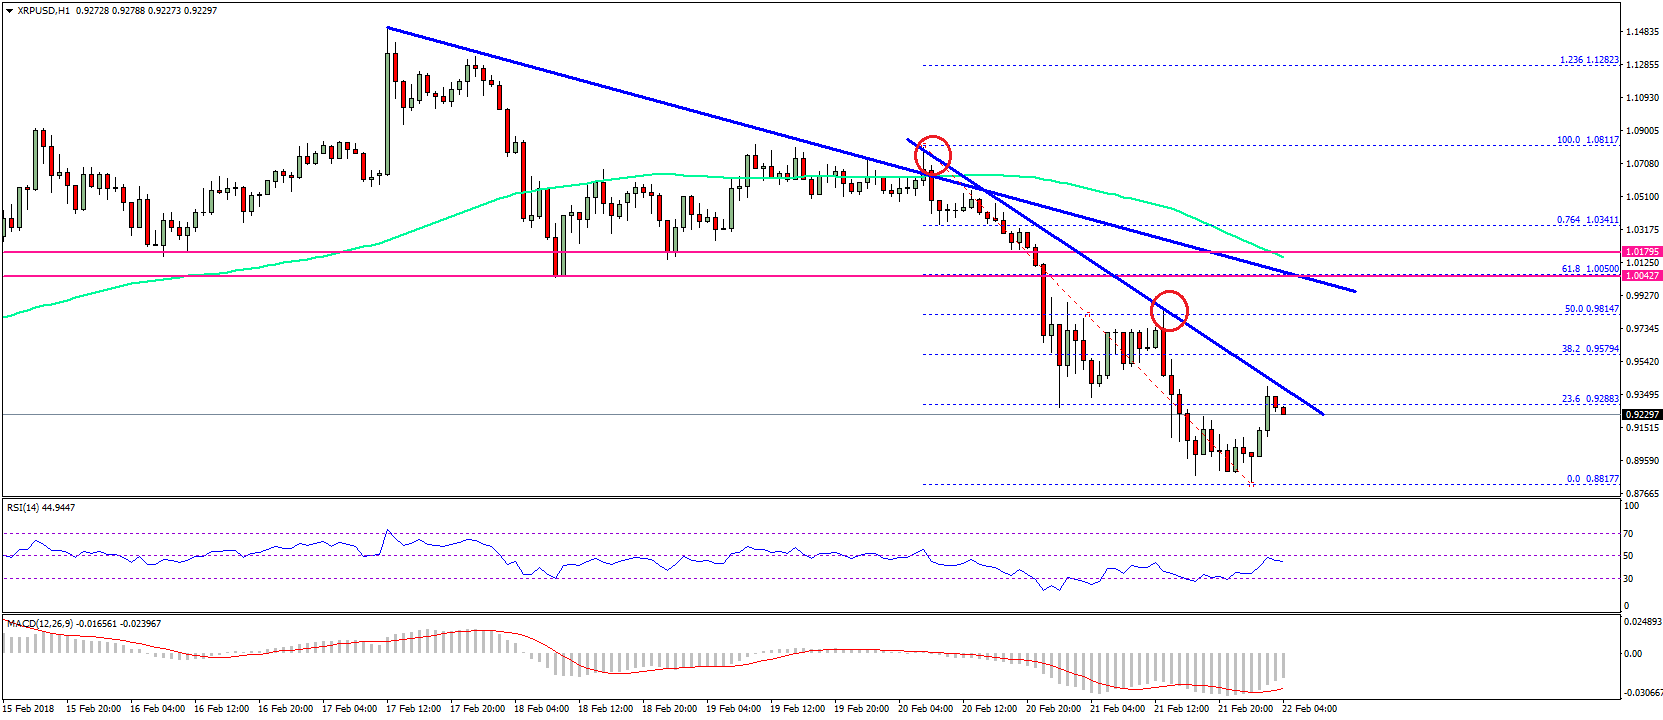
- There are two important bearish trend lines forming with resistance at $0.9400 and $1.00 on the hourly chart of the XRP/USD pair (data source from SimpleFx).
- The pair is currently correcting higher, but it is likely to face a lot of sellers on the upside near 0.9500.
Ripple price declined further during the past few hours against the US Dollar and Bitcoin. XRP/USD is currently recovering, but upsides are likely to be capped.
Ripple Price Resistance
There was no respite for buyers as Ripple price declined further below $0.9800 against the US Dollar. The price traded lower and even broke the $0.9500 support level. It was under a lot of pressure, which resulted in a push below $0.9000. A low was formed near $0.8817 from where the price started an upside correction above the $0.9000 level.
It is currently testing the 23.6% Fib retracement level of the last drop from the $1.0811 high to $0.8817 low. There are many hurdles on the upside for buyers starting with $0.9500. Moreover, there are two important bearish trend lines forming with resistance at $0.9400 and $1.00 on the hourly chart of the XRP/USD pair. The second trend line resistance is very important since is it close to $1.00 and the 100 hourly simple moving average. Furthermore, the 50% Fib retracement level of the last drop from the $1.0811 high to $0.8817 low is at $0.9815 to prevent upsides.

Therefore, if the price corrects higher from the current levels, then it could face sellers near $0.9600 and $0.9800. On the downside, the $0.9000 level is a major support followed by $0.8800.
Looking at the technical indicators:
Hourly MACD – The MACD for XRP/USD is currently reducing its bearish slope.
Hourly RSI (Relative Strength Index) – The RSI for XRP/USD is currently just below the 50 level.
Major Support Level – $0.9000
Major Resistance Level – $0.9800
Charts courtesy – SimpleFX