Key Highlights
- Ripple price is holding a major support level near $0.6550 against the US dollar.
- There is a short-term declining channel forming with resistance near $0.6900 on the hourly chart of the XRP/USD pair (data source from Kraken).
- The pair remains supported on the downside above the $0.6500 level and the 100 hourly simple moving average.
Ripple price is consolidating gains against the US Dollar and Bitcoin. XRP/USD may dip a few points, but it remains supported above the $0.6500 level.
Ripple Price Trend
There was a slow and steady upside move in Ripple price above the $0.6200 against the US Dollar. The price traded higher and moved above the $0.7000 level. It is now trading in a bullish zone above the $0.6560 level and the 100 hourly simple moving average. The recent high was formed at $0.7258 from where a downside correction was initiated.
XRP price has moved below the 23.6% Fib retracement level of the last wave from the $0.5342 low to $0.7258 high. There is also a short-term declining channel forming with resistance near $0.6900 on the hourly chart of the XRP/USD pair. However, the pair remains well supported above the $0.6500 level and the 100 hourly SMA. The stated $0.6500 support is also near the 38.2% Fib retracement level of the last wave from the $0.5342 low to $0.7258 high. Therefore, any major dips from the current levels could find buyers above $0.6500.
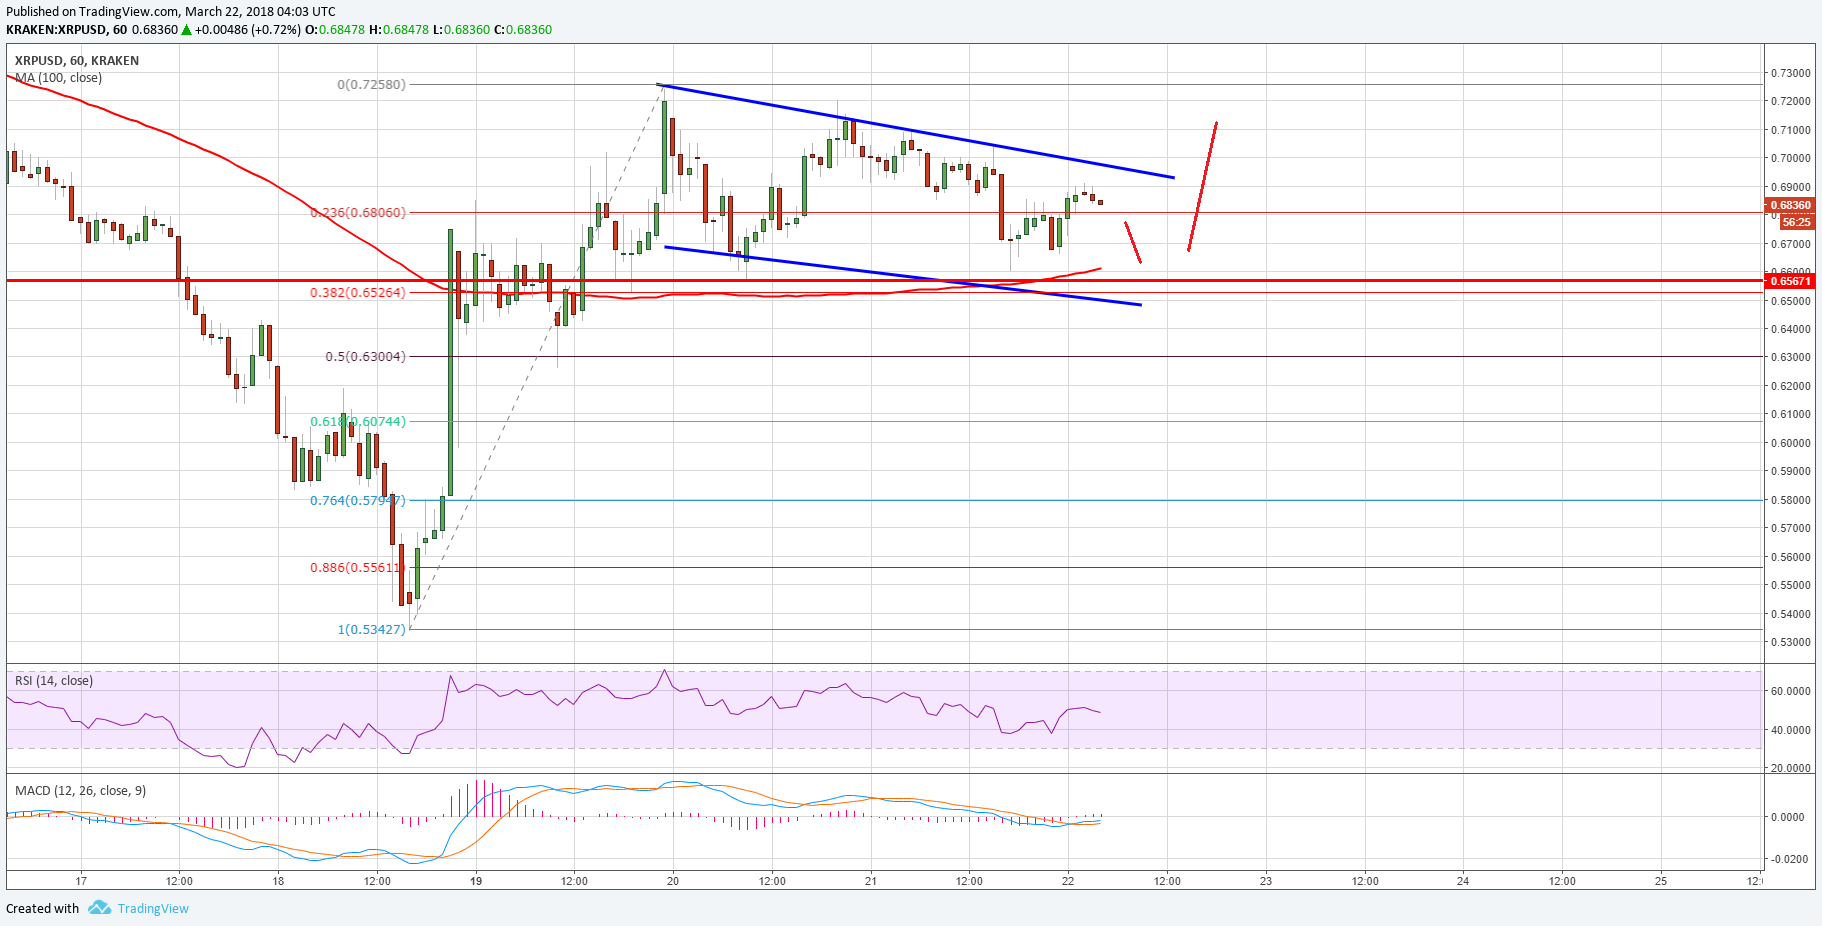

A break below the $0.6500 support and a close below the 100 hourly SMA may push the price in a bearish zone. On the upside, the channel resistance at $0.6900 must be breached for a retest of $0.7250. Above $0.7250, the price may rise towards the $0.7400 level.
Looking at the technical indicators:
Hourly MACD – The MACD for XRP/USD is about to move into the bullish zone.
Hourly RSI (Relative Strength Index) – The RSI for XRP/USD is currently just below the 50 level.
Major Support Level – $0.6500
Major Resistance Level – $0.6900
Charts courtesy – Trading View