Key Highlights
- Ripple price started a nice upside move and traded above the $0.6500 level against the US dollar.
- There is a short-term connecting bullish trend line forming with support at $0.6850 on the hourly chart of the XRP/USD pair (data source from Kraken).
- The pair is currently placed nicely above $0.6500 and 100 hourly simple moving average for further gains.
Ripple price is trading with a positive bias against the US Dollar and Bitcoin. XRP/USD may continue to move higher and it could even break the $0.7500 resistance.
Ripple Price Trend
There was a decent start of an upward wave in Ripple price above the $0.6000 level against the US Dollar. The price traded higher and succeeded in settling above the $0.6200 resistance. There was a break above a major bearish trend line with resistance at $0.6500 on the hourly chart of the XRP/USD pair. It opened the gates for more gains and the price settled above the $0.6800 level and the 100 hourly simple moving average.
The recent high was $0.7247 from where a downside correction was initiated. XRP price tested the 38.2% Fib retracement level of the last wave from the $0.6277 low to $0.7247 high. On the downside, there is a short-term connecting bullish trend line forming with support at $0.6850 on the hourly chart. The trend line support is close to the 50% Fib retracement level of the last wave from the $0.6277 low to $0.7247 high. Therefore, the $0.6600-0.6800 zone is a decent buy area.
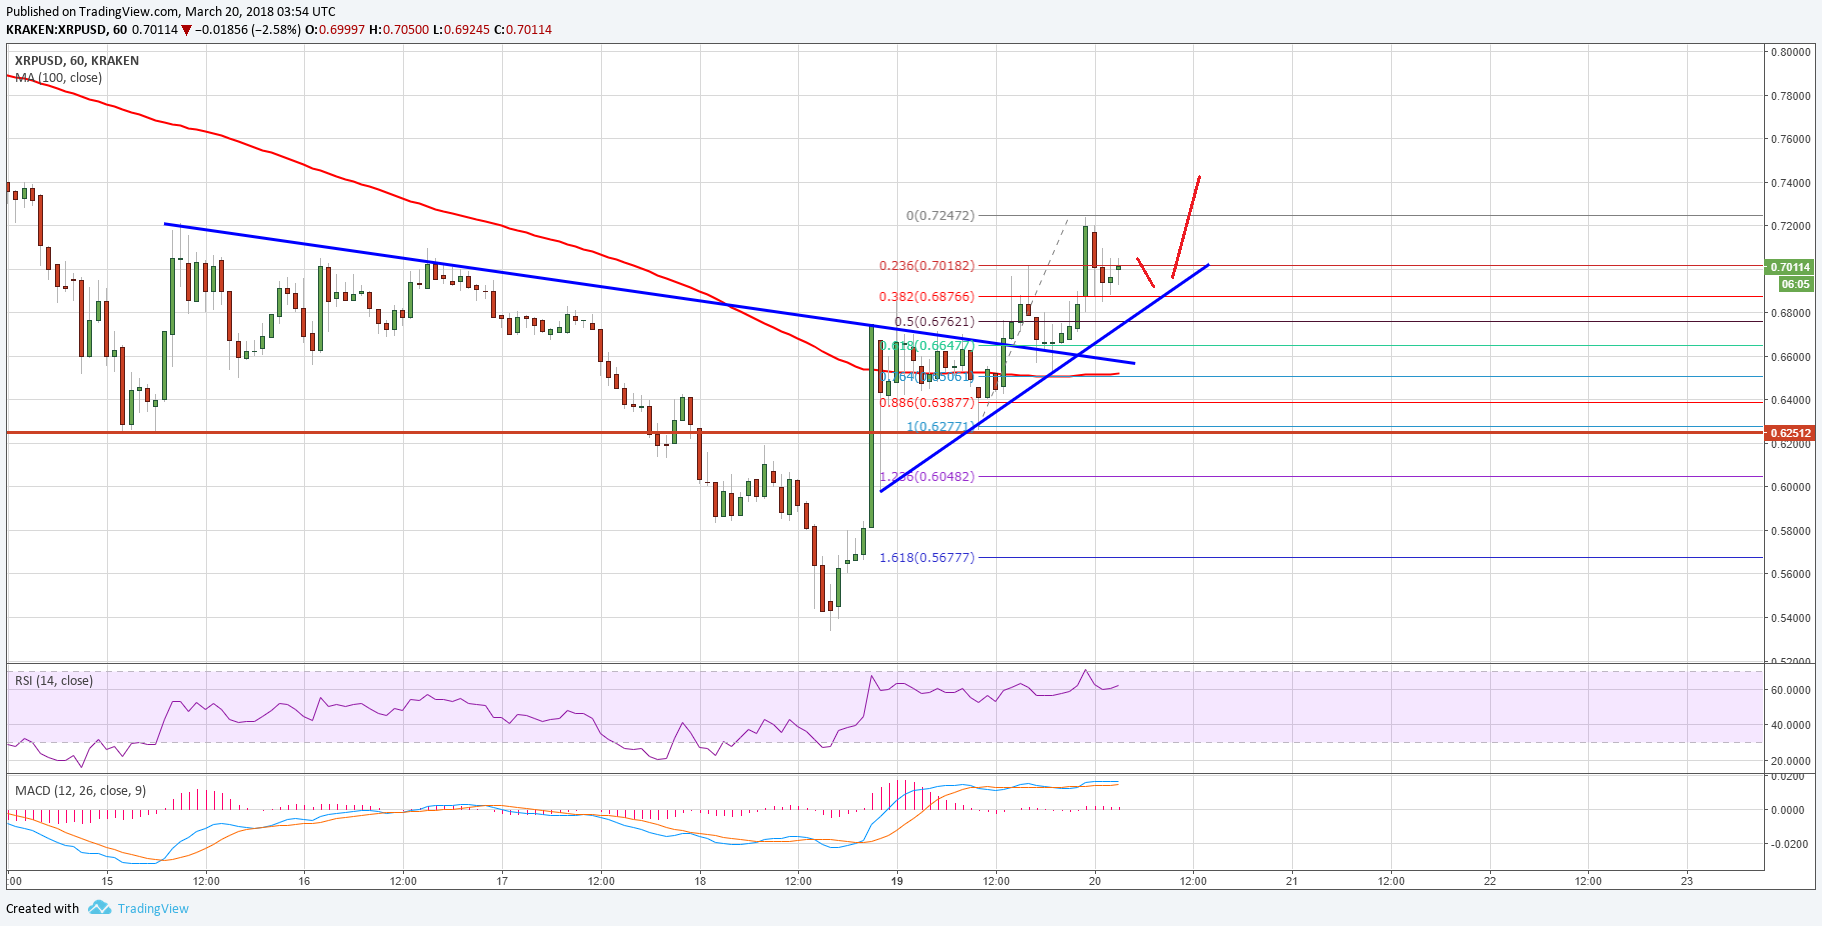

As long as the price is above $0.6600, it may continue to rise in the near term. On the upside, a break above the $0.7250 resistance is needed for a push towards the $0.8000 level.
Looking at the technical indicators:
Hourly MACD – The MACD for XRP/USD is slightly in the bullish zone.
Hourly RSI (Relative Strength Index) – The RSI for XRP/USD is above the 60 level.
Major Support Level – $0.6600
Major Resistance Level – $0.7250
Charts courtesy – Trading View