Key Highlights
- Ripple price is under a lot of pressure as it moved below the $0.7000 support against the US dollar.
- This week’s highlighted monster contracting triangle pattern with support near $0.7500 was broken on the hourly chart of the XRP/USD pair (data source from Kraken).
- The pair is currently trading above the $0.6000 level, but it remains at a risk of more losses.
Ripple price fell sharply against the US Dollar and Bitcoin. XRP/USD could extend declines in the near term as long as it is below the $0.7000 level.
Ripple Price Resistance
Buyers failed to initiate an upside move above $0.8200 in Ripple price against the US Dollar. As a result, there was a downside move and the price dropped below a major support at $0.7700. More importantly, this week’s highlighted monster contracting triangle pattern with support near $0.7500 was broken on the hourly chart of the XRP/USD pair.
The price even broke the last swing low of $0.7400 and the $0.7000 support. It is now trading well below the $0.7000 level and the 100 hourly simple moving average. The recent low formed was $0.6246 and it seems like the price may extend the current decline. An initial hurdle on the upside is around the 23.6% Fib retracement level of the last decline from the $0.7900 high to $0.6246 low. However, the most important resistance is near $0.7000, which was a support earlier. The same level is also the 50% Fib retracement level of the last decline from the $0.7900 high to $0.6246 low.
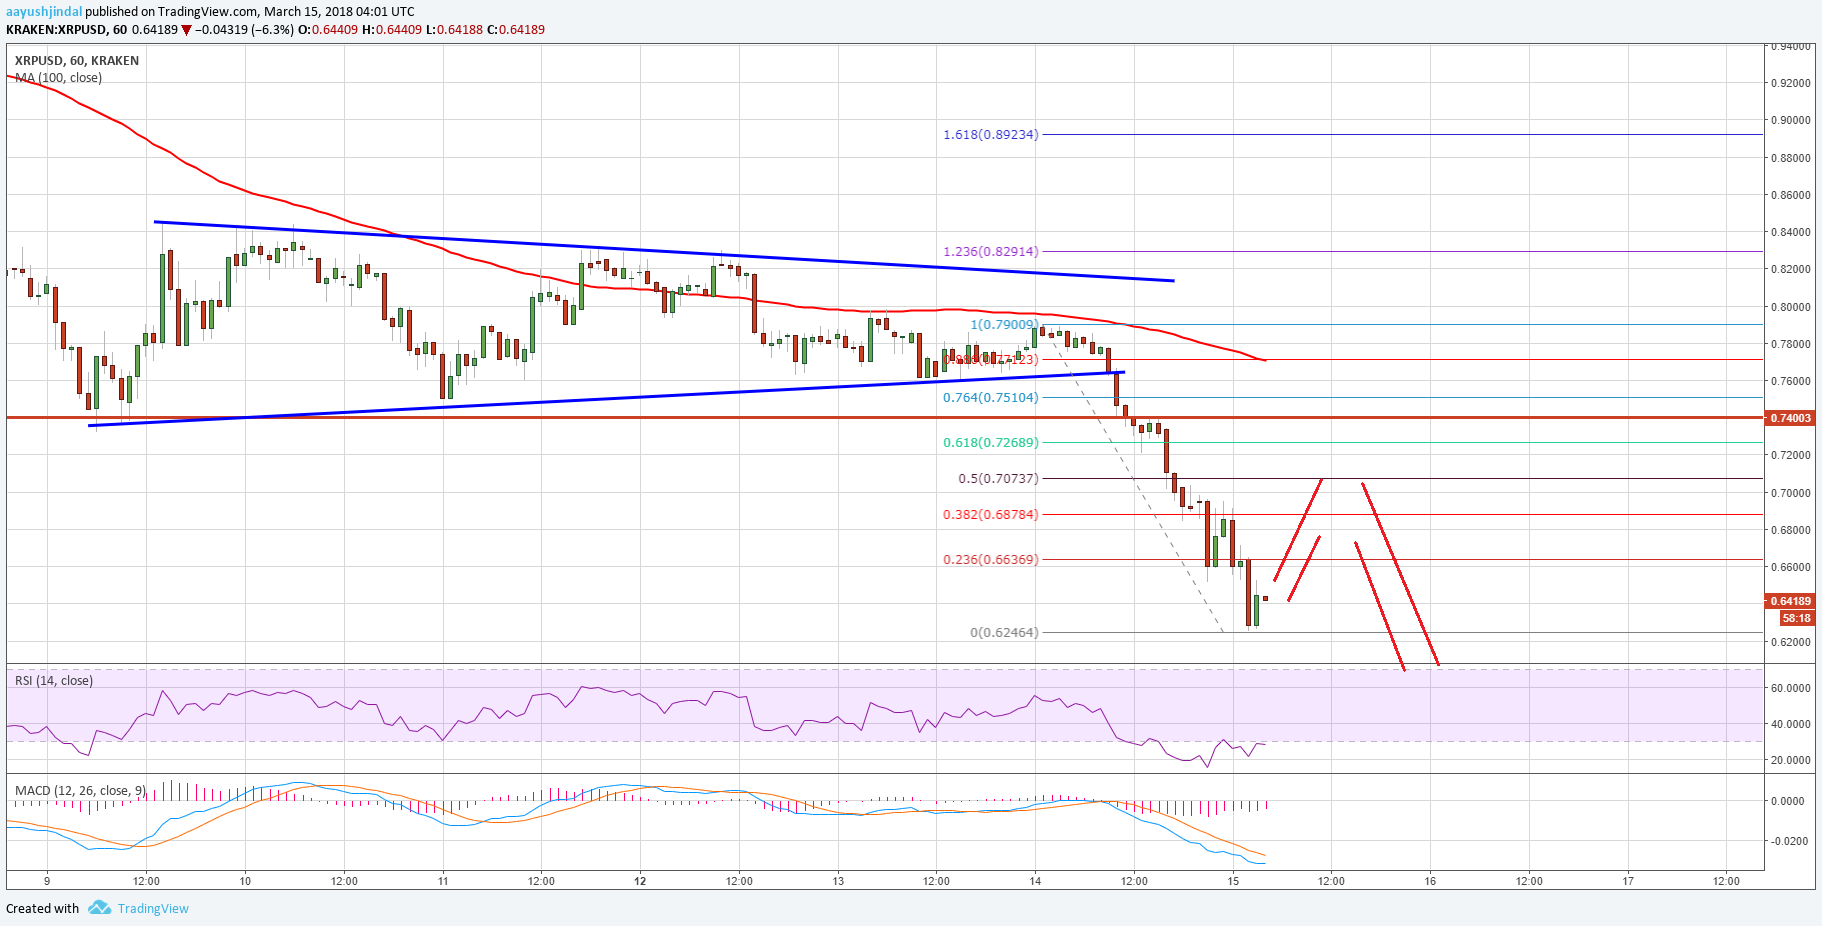

On the downside, the recent low of $0.6246 could be breached for a test of $0.6000. Below $0.6000, there are chances of XRP price moving towards the $0.5000 level.
Looking at the technical indicators:
Hourly MACD – The MACD for XRP/USD is now in the bearish zone.
Hourly RSI (Relative Strength Index) – The RSI for XRP/USD is consolidating near the oversold levels.
Major Support Level – $0.6000
Major Resistance Level – $0.7000
Charts courtesy – Trading View