

Key Highlights
- Ripple price tumbled sharply and moved below the $1.0000 support against the US dollar.
- There is a crucial bearish trend line forming with resistance at $1.0200 on the hourly chart of the XRP/USD pair (data source from SimpleFx).
- The pair is likely to extend declines and it could even break below the $0.7500 support in the near term.
Ripple price is under immense pressure against the US Dollar and Bitcoin. XRP/USD is likely to accelerate declines below the $0.7500 support level.
Ripple Price Decline
There was the start to a new downside wave yesterday from the $1.1500 high in Ripple price against the US Dollar. The price tumbled and moved below the $1.0000 and $0.9000 support levels. To initiate the downside move, there was a break below a contracting triangle with support at $1.0600 on the hourly chart of the XRP/USD pair. It traded close to the $0.8000 level and formed a low at $0.8038.
It is currently attempting a correction from $0.8500. An initial resistance is around the 23.6% Fib retracement level of the last decline from the $1.0814 high to $0.8038 low. There are many hurdles on the upside around the $0.9000. The most important resistance is at $0.9750. It was a support earlier and now it could prevent gains above $1.0000. An intermediate resistance is the 50% Fib retracement level of the last decline from the $1.0814 high to $0.8038 low at $0.9420.
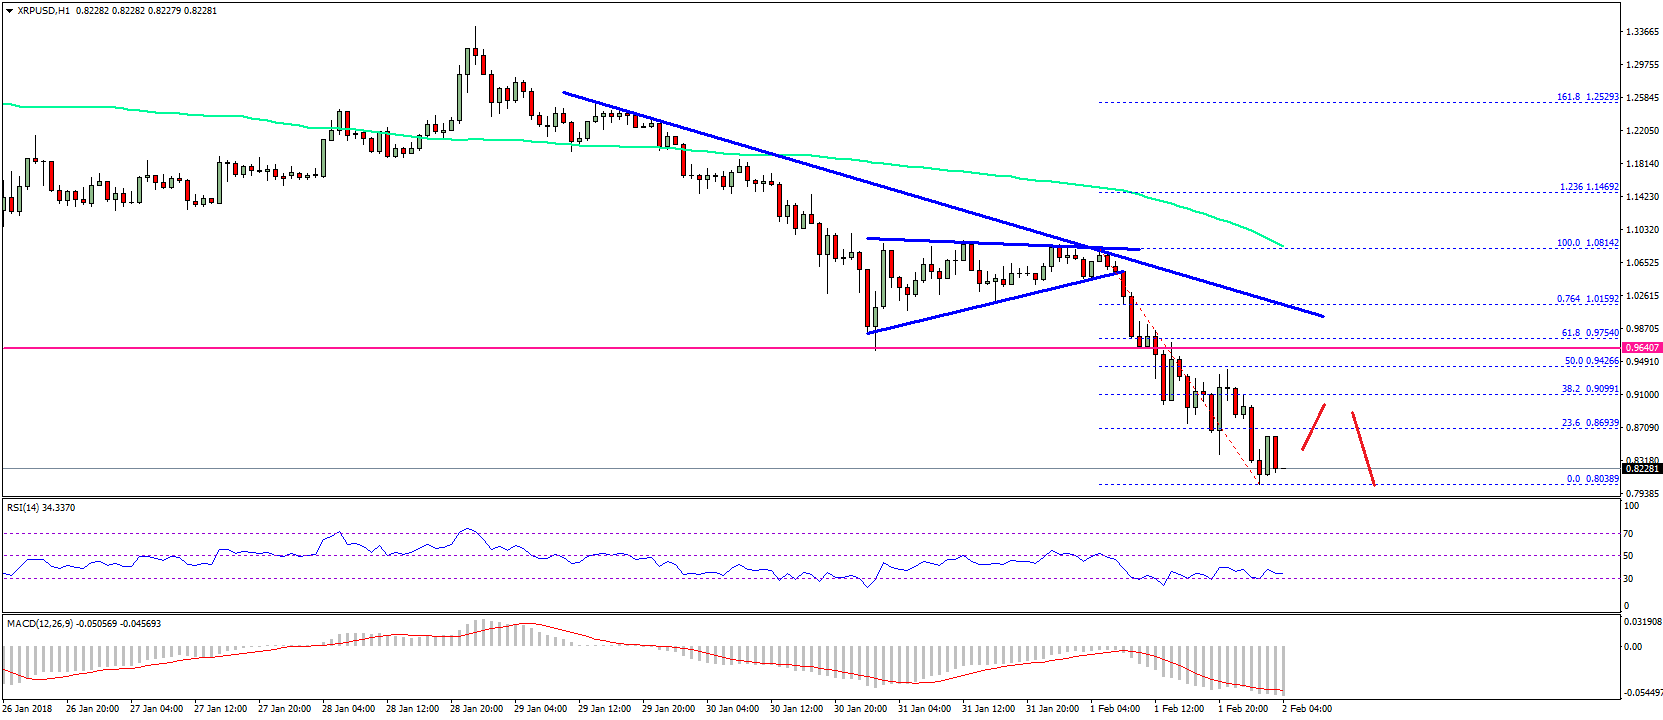

Clearly, the price is under a lot of pressure below $1.0000. It seems like it could even break the $0.8030 swing low. The next major support is around the $0.7500 level. If the current pressure remains intact, the price may even break the $0.7500 level.
Looking at the technical indicators:
Hourly MACD – The MACD for XRP/USD is currently moving heavily in the bearish zone.
Hourly RSI (Relative Strength Index) – The RSI for XRP/USD is moving lower and is well below 40.
Major Support Level – $0.7500
Major Resistance Level – $0.9500
Charts courtesy – SimpleFX