Key Highlights
- Ripple price is holding an important support at $0.1950 against the US Dollar.
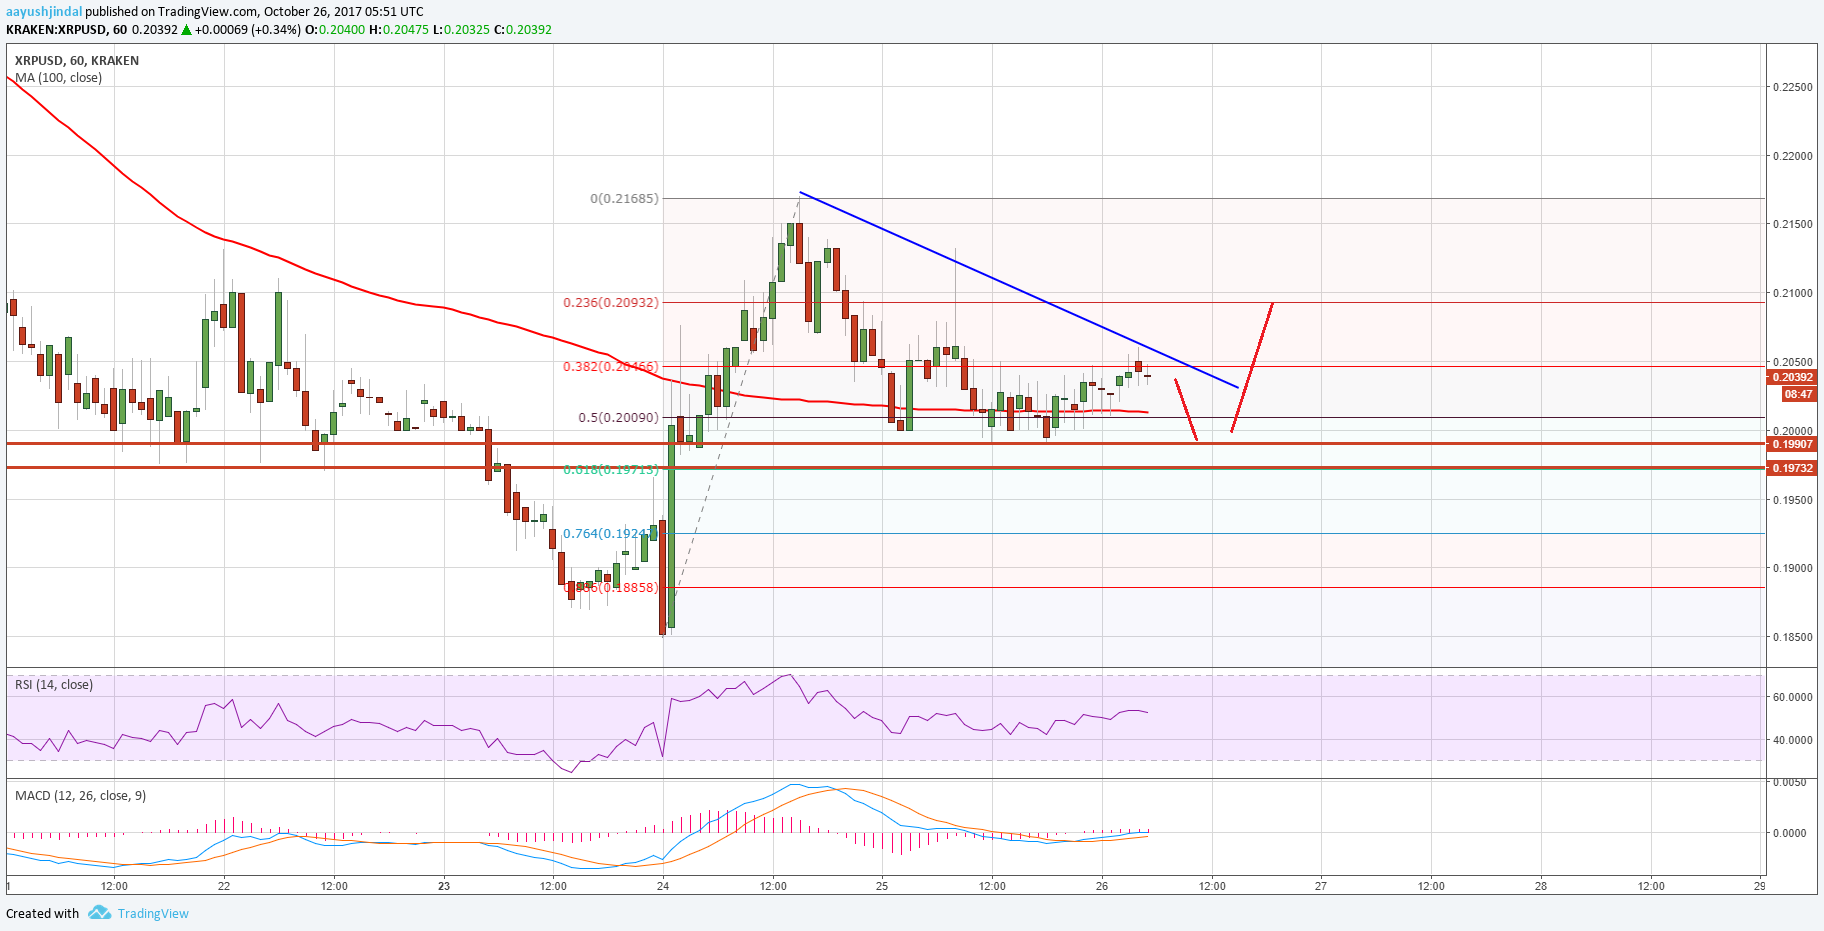
- There is a bearish trend line forming with resistance at $0.2050 on the hourly chart of the XRP/USD pair (data source from Kraken).
- The price might break the $0.2050 resistance to trade towards the $0.2150 level in the near term.
Ripple price is trading in a range against the US Dollar and Bitcoin. XRP/USD needs to break the $0.2050 resistance to gain upside momentum.
Ripple Price Resistance
There was not much action during the past few hours in Ripple price, but it held the $0.1950 support against the US Dollar. Recently, the price started a downside move from the $0.2165 swing high and corrected below the 38.2% Fib retracement level of the last leg up from the $0.1850 low to $0.2165 high. However, the downside move was protected by the $0.1950-60 support zone and the 100 hourly simple moving average.
Moreover, the 50% Fib retracement level of the last leg up from the $0.1850 low to $0.2165 high is currently acting as a strong support. As long as the price is above $0.1950-0.1960 and the 100 hourly SMA, it remains supported. On the upside, there is a bearish trend line forming with resistance at $0.2050 on the hourly chart of the XRP/USD pair. A break above the $0.2050 resistance would open the doors for more gains above the $0.2100 level. The next stop could be the last swing high near $0.2165-68.
The current bias seems to be neutral above $0.1950. We need to wait for an upside break towards $0.2150 for the next major move in the near term.
Looking at the technical indicators:
Hourly MACD – The MACD for XRP/USD is slowly moving into the bullish zone.
Hourly RSI (Relative Strength Index) – The RSI for XRP/USD is currently above the 50 level.
Major Support Level – $0.1960-50
Major Resistance Level – $0.2050
Charts courtesy – Trading View, Kraken