

Key Highlights
- Ripple price is placed well above the $0.2150 support and eyeing further gains against the US Dollar.
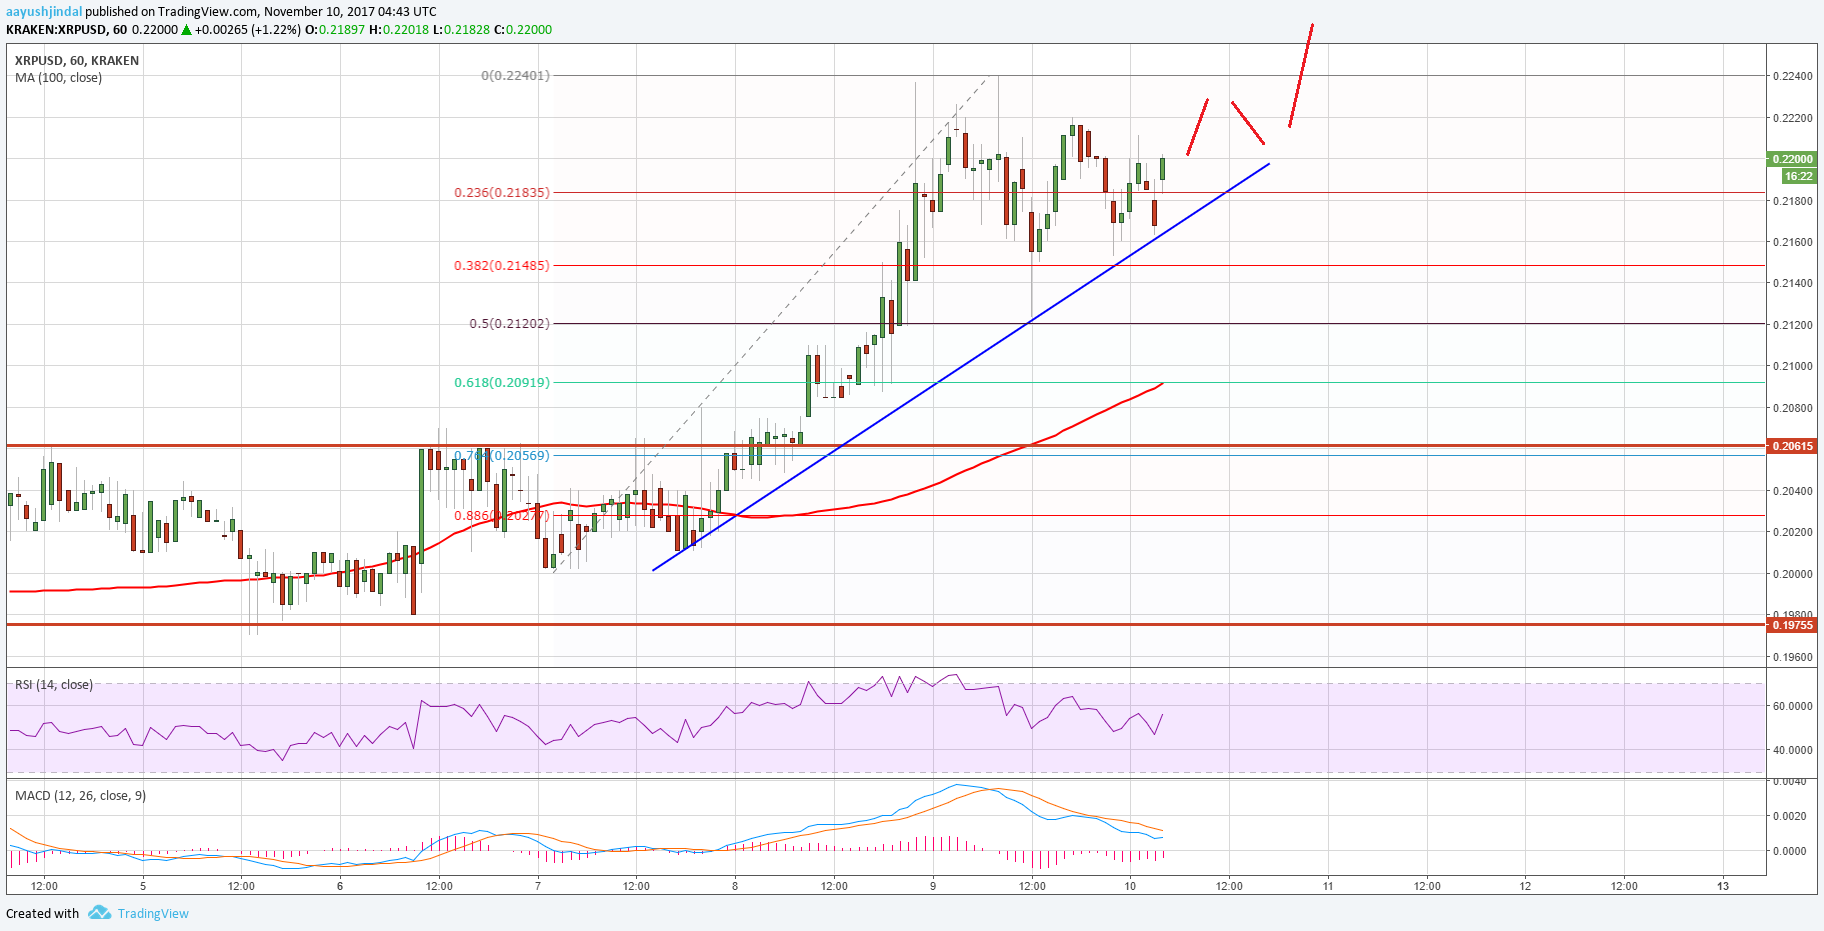
- There is a new connecting bullish trend line forming with support at $0.2180 on the hourly chart of the XRP/USD pair (data source from Kraken).
- The price is likely to move higher and it could even break the $0.2250 resistance in the near term.
Ripple price is eyeing more gains against the US Dollar and Bitcoin. XRP/USD might break higher above the $0.2250 level to test $0.2300.
Ripple Price Support
It seems like Ripple price is forming a decent support base above $0.2150 against the US Dollar. The price even settled above the $0.2180 level and recently traded as high as $0.2240. After trading near $0.2240, the price started a downside correction and traded below the 23.6% Fib retracement level of the last wave from the $0.2000 low to $0.2240 high.
The downside move was limited since the $0.2120 support held losses. Moreover, the 50% Fib retracement level of the last wave from the $0.2000 low to $0.2240 high acted as a major support. It seems like there is a new connecting bullish trend line forming with support at $0.2180 on the hourly chart of the XRP/USD pair. The pair is following the trend line and is currently placed above the $0.2200 level. It might soon gain pace and attempt an upside break above the $0.2250 level in the near term.
The next upside hurdle is near $0.2300 where sellers might appear. On the downside, the $0.2150 support is important along with the trend line. Only a close below $0.2120 would call for a test of the next support at $0.2000.
Looking at the technical indicators:
Hourly MACD – The MACD for XRP/USD is attempting to move back in the bullish zone.
Hourly RSI (Relative Strength Index) – The RSI for XRP/USD is above the 50 level and heading higher.
Major Support Level – $0.2180
Major Resistance Level – $0.2250
Charts courtesy – Trading View, Kraken