Key Highlights
- Ripple price is back in the range above the $0.1960 support zone against the US Dollar.
- There is a bearish trend line forming with resistance at $0.1990 on the hourly chart of the XRP/USD pair (data source from Kraken).
- The price might soon break $0.2000 to trade towards $0.2050 or even $0.2100.
Ripple price is back trading in a range against the US Dollar and Bitcoin. XRP/USD might attempt an upside break above $0.2000 in the near term.
Ripple Price Resistance
After a test of the $0.2200 level, there was a downside reaction in Ripple price against the US Dollar. The price traded below the $0.2100 support and moved below the 38.2% Fib retracement level of the last leg up from the $0.1800 low to $0.2200 high. However, the downside move was protected by the all-important $0.1980-0.1960 support area.
Moreover, the 50% Fib retracement level of the last leg up from the $0.1800 low to $0.2200 high also acted as a support. At present, the price is trading in a familiar range above the $0.1950 support area and flirting with the 100 hourly simple moving average. On the upside, there is a bearish trend line forming with resistance at $0.1990 on the hourly chart of the XRP/USD pair. A break above the trend line resistance is required for a move towards $0.2050.
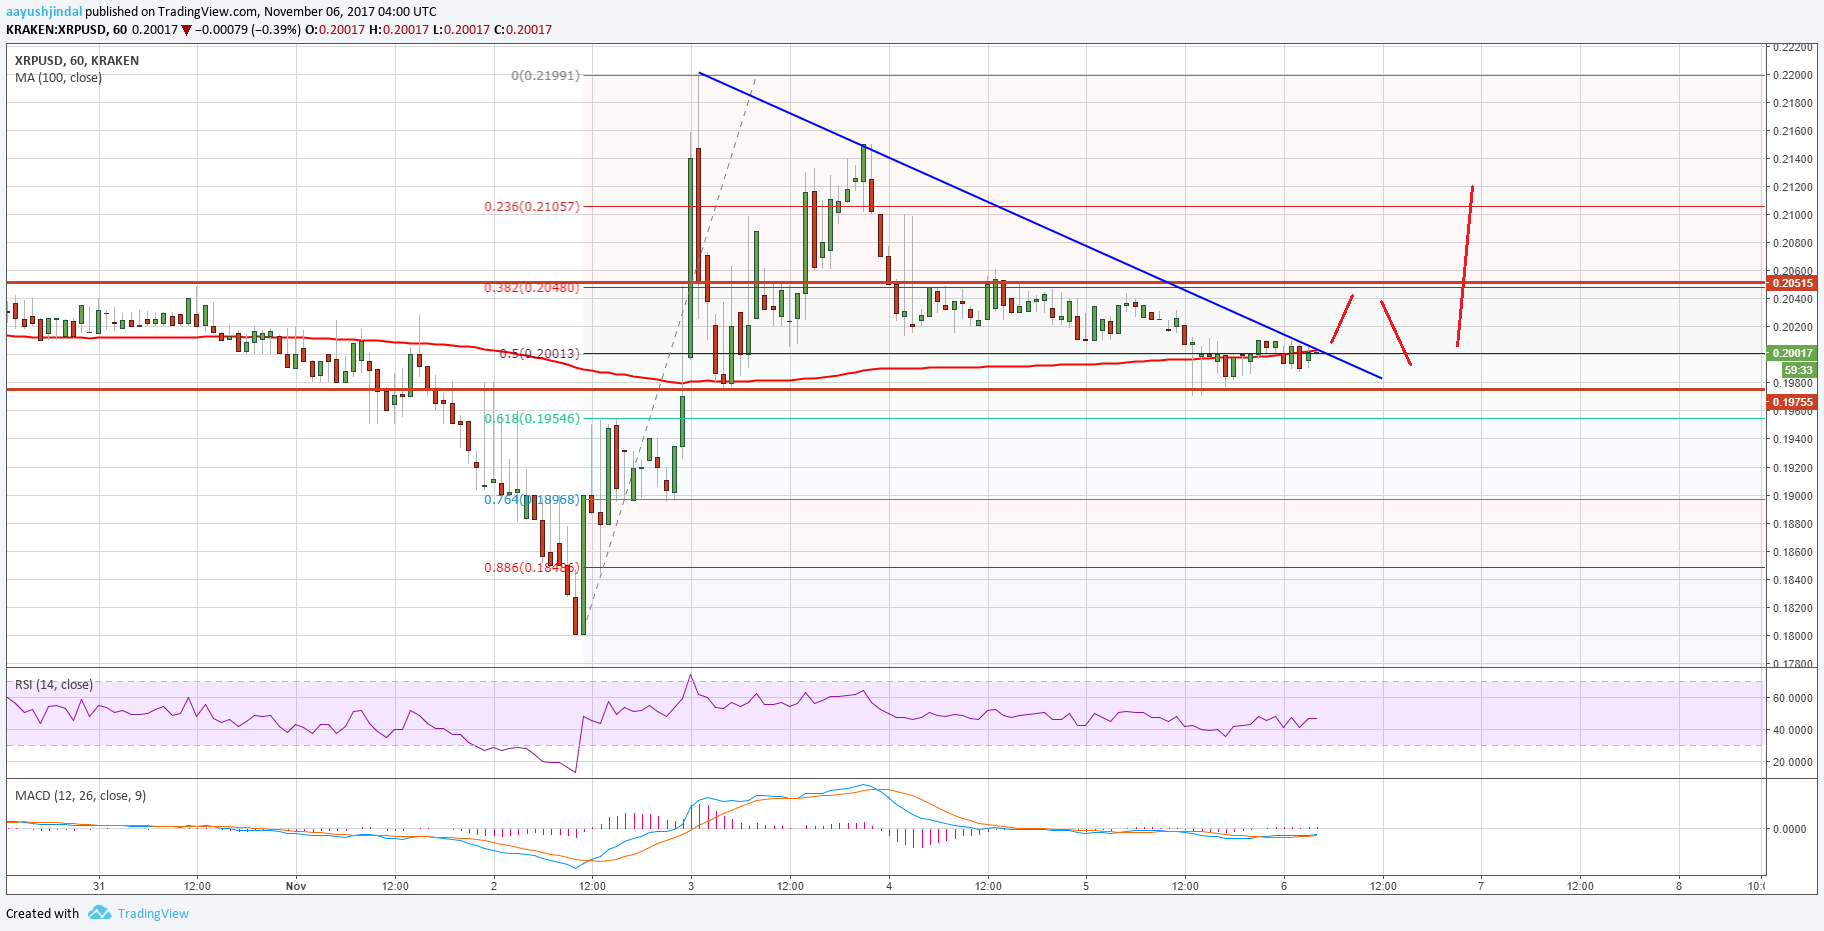
However, if buyers remain in control, there can be an upside extension towards the $0.2100 level as well. On the downside, the $0.1980 and $0.1960 levels are important supports. Furthermore, the $0.1950 level is a crucial pivot and buy zone. As long as the price is above $0.1960, there can be an upside break soon.
Looking at the technical indicators:
Hourly MACD – The MACD for XRP/USD is slowly moving back in the bullish zone.
Hourly RSI (Relative Strength Index) – The RSI for XRP/USD is just around the 50 level.
Major Support Level – $0.1960
Major Resistance Level – $0.2000
Charts courtesy – Trading View, Kraken