Key Highlights
- Ripple price is recovering and recently moved above the $0.2040 level against the US Dollar.
- Yesterday’s highlighted two bearish trend lines with resistance at $0.2040 were broken on the hourly chart of the XRP/USD pair (data source from Kraken).
- The price is currently above the 100 hourly simple moving average and $0.2050, which is a positive sign.
Ripple price is gaining pace against the US Dollar and Bitcoin. XRP/USD might continue to move higher toward the $0.2100 and $0.2150 levels.
Ripple Price Support
It seems like a decent recovery is triggered from the $0.1970 swing low in Ripple price against the US Dollar. The price has managed to move above a couple of important resistances such as $0.2000 and $0.2030. There was a push above the 38.2% Fib retracement level of the last drop from the $0.2238 high to $0.1900 low. It opened the doors for more gains, and the price settled above the 100 hourly simple moving average and $0.2050.
The best part was a break above yesterday’s highlighted two bearish trend lines with resistance at $0.2040 on the hourly chart of the XRP/USD pair. The pair is now above the 50% Fib retracement level of the last drop from the $0.2238 high to $0.1900 low. It might continue to gain pace toward $0.2100 in the near term. Any corrections or dips from the current levels might find support near $0.2040 and the 100 hourly simple moving average.
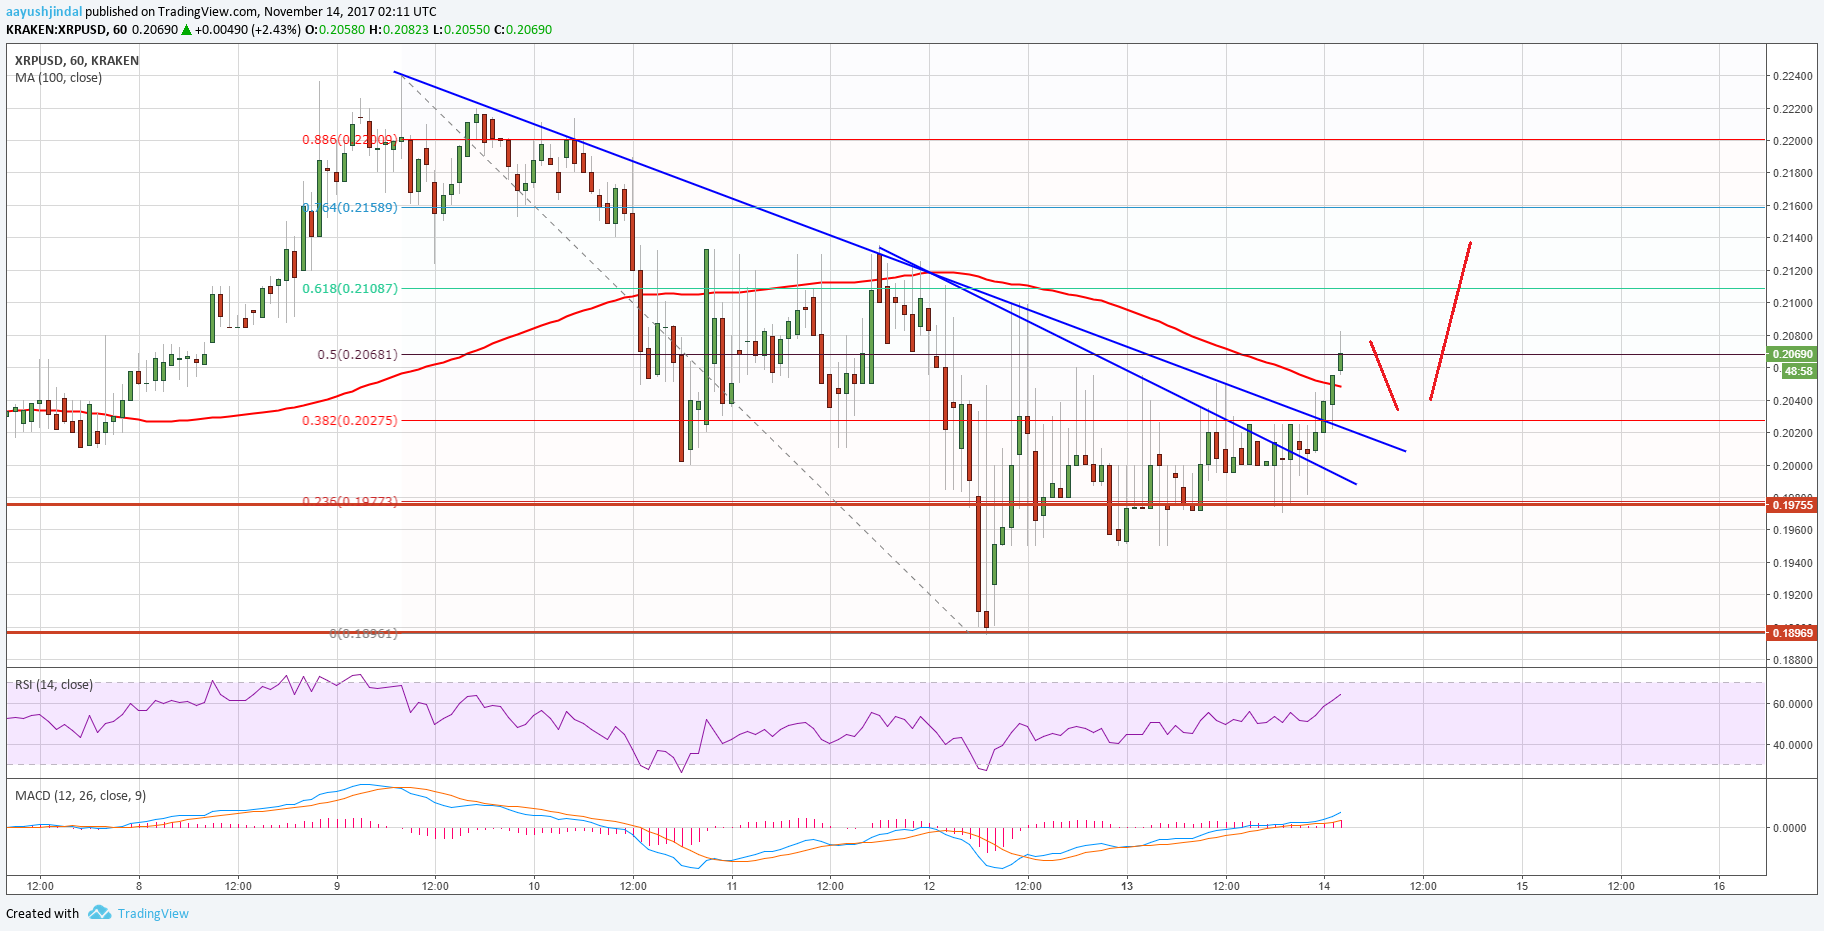
Moreover, the broken trend lines could provide support near $0.2020 followed by $0.2000. Therefore, there are chances of more gains in XRP as long as the price is above the $0.2000 level.
Looking at the technical indicators:
Hourly MACD – The MACD for XRP/USD is gaining pace in the bullish zone.
Hourly RSI (Relative Strength Index) – The RSI for XRP/USD is well above the 50 level and moving higher.
Major Support Level – $0.2040
Major Resistance Level – $0.2150
Charts courtesy – Trading View, Kraken