Key Highlights
- Ripple price is struggling to move above the $0.2050 resistance against the US Dollar.
- There is a new bearish trend line forming with current resistance at $0.2040 on the hourly chart of the XRP/USD pair (data source from Kraken).
- The price might continue to trade in a range with support at $0.1975 and resistance at $0.2040.
Ripple price is trading in a tiny range against the US Dollar and Bitcoin. XRP/USD has to settle above the $0.2050 level to break barriers in the near term.
Ripple Price Range
Yesterday, we saw the start of range trading in Ripple price above the $0.1950 support against the US Dollar. The price remained in the mentioned, but also struggled to break the $0.2050 resistance. There were 2-3 attempts to settle above $0.2050 and $0.2060, but buyers failed. As a result, the price continued to trade in a range and held an important support at $0.1975-0.1960.
On the upside, there is a new bearish trend line forming with current resistance at $0.2040 on the hourly chart of the XRP/USD pair. The trend line resistance is near the 38.2% Fib retracement level of the last decline from the $0.2180 high to $0.1971 low. The 100 hourly simple moving average is also positioned near $0.2040 and the trend line resistance.
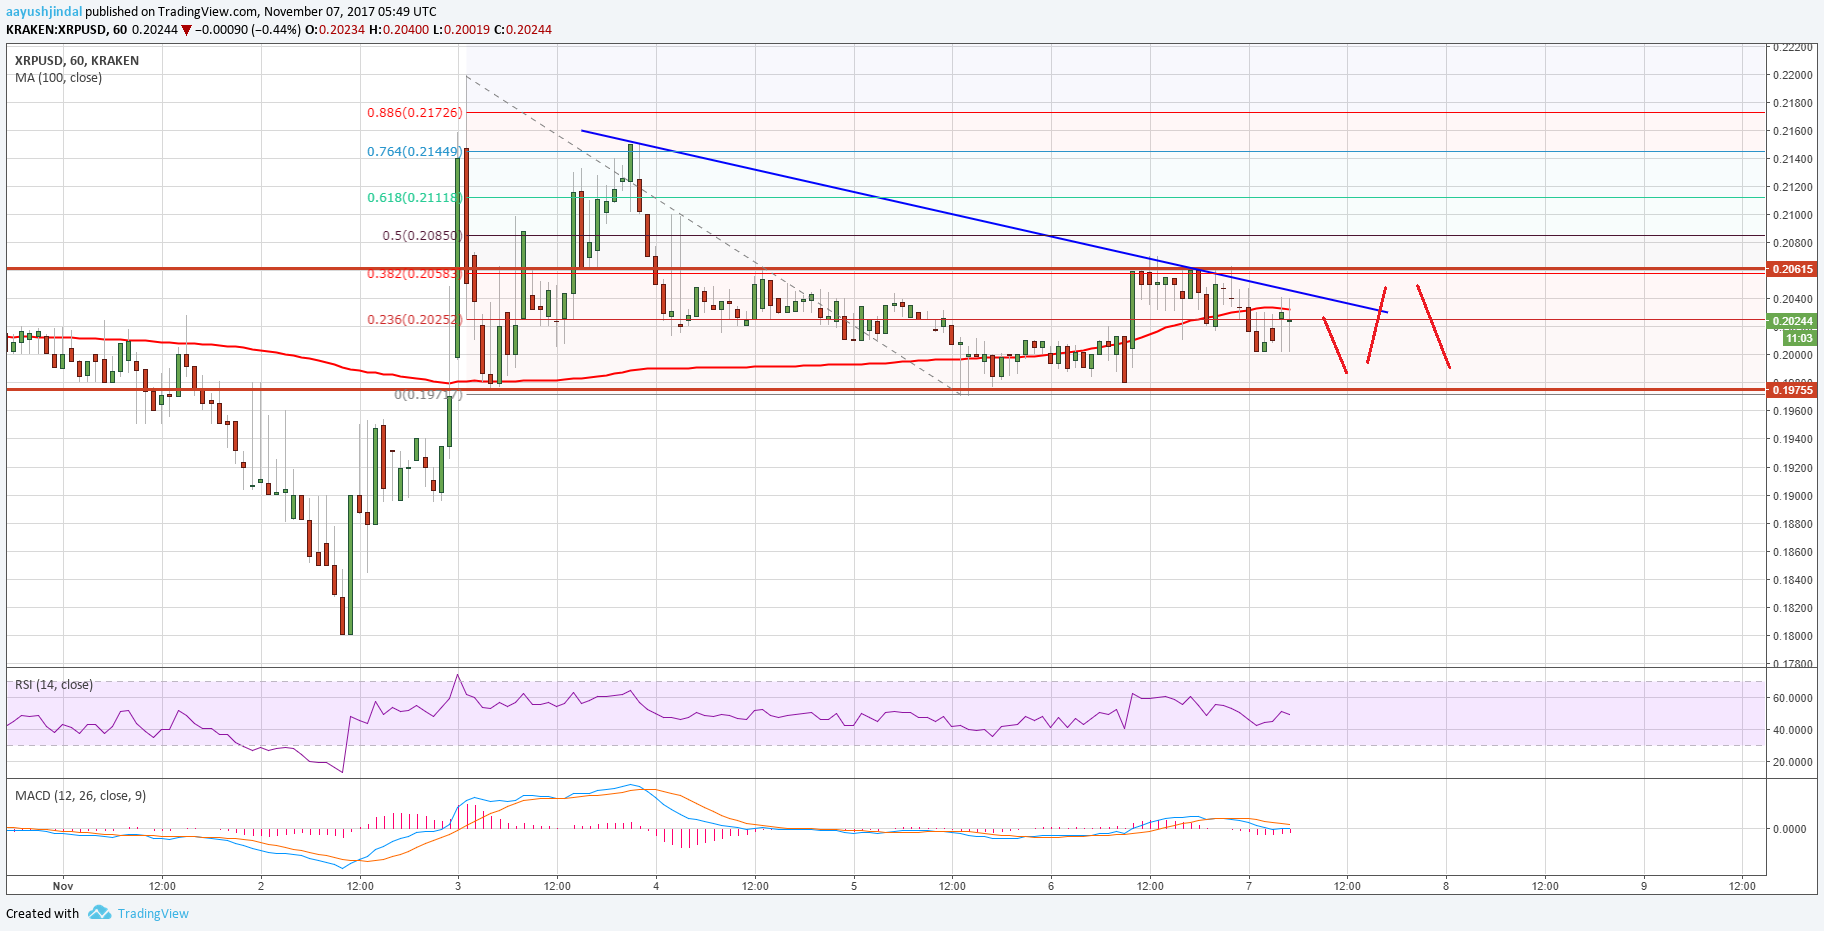
A close above $0.2040 would call for a test of the 50% Fib retracement level of the last decline from the $0.2180 high to $0.1971 low. A successful close above $0.2050 followed by $0.2100 is needed for buyers to push the price towards $0.2180 and $0.2200. On the downside, the $0.1975 range support holds a lot of importance followed by $0.1960.
Looking at the technical indicators:
Hourly MACD – The MACD for XRP/USD is almost flat in the bearish zone.
Hourly RSI (Relative Strength Index) – The RSI for XRP/USD is just above the 50 level.
Major Support Level – $0.1975
Major Resistance Level – $0.2040
Charts courtesy – Trading View, Kraken
SaveSave