

- Ripple price is struggling to clear the $0.3000 and $0.3100 resistance levels against the US dollar.
- There is a crucial bearish trend line formed with resistance at $0.3000 on the 4-hours chart of the XRP/USD pair (data source from Kraken).
- The pair must gain momentum above $0.3000 and the 100 simple moving average (4-hours) for more gains.
- On the downside, a break below the $0.2940 support could trigger bearish moves in the near term.
Ripple price corrected lower after a decent upward move against the US Dollar and bitcoin. XRP/USD is likely to make the next move either above $0.3000 or below $0.2900.
Ripple Price Analysis
After forming a support near the $0.2850 level, ripple price made a nice upward move against the US Dollar. The XRP/USD pair rallied and broke the $0.3000 and $0.3150 resistance levels. The price traded close to the $0.3200 level, where sellers emerged. A high was formed at $0.3198 before the price started a downside correction. There was a sharp decline below the $0.3100 and $0.3000 support levels. Sellers pushed the price below the 50% Fib retracement level of the last wave from the $0.2853 low to $0.3198 high. Besides, there was a close below the $0.3000 level and the 100 simple moving average (4-hours).
Similarly, there were bearish moves in bitcoin, Ethereum, eos, litecoin and other altcoins. Later, ripple found support near the $0.2940 and $0.2950 levels. It traded close to the 76.4% Fib retracement level of the last wave from the $0.2853 low to $0.3198 high. Finally, the price started trading in a range between the $0.2940 and $0.3050 levels. On the upside, there is a crucial bearish trend line formed with resistance at $0.3000 on the 4-hours chart of the XRP/USD pair. Therefore, a break above the trend line and $0.3040 could open the doors for more gains. The next key resistance is near the $0.3110 level, above which the price may test $0.3200.
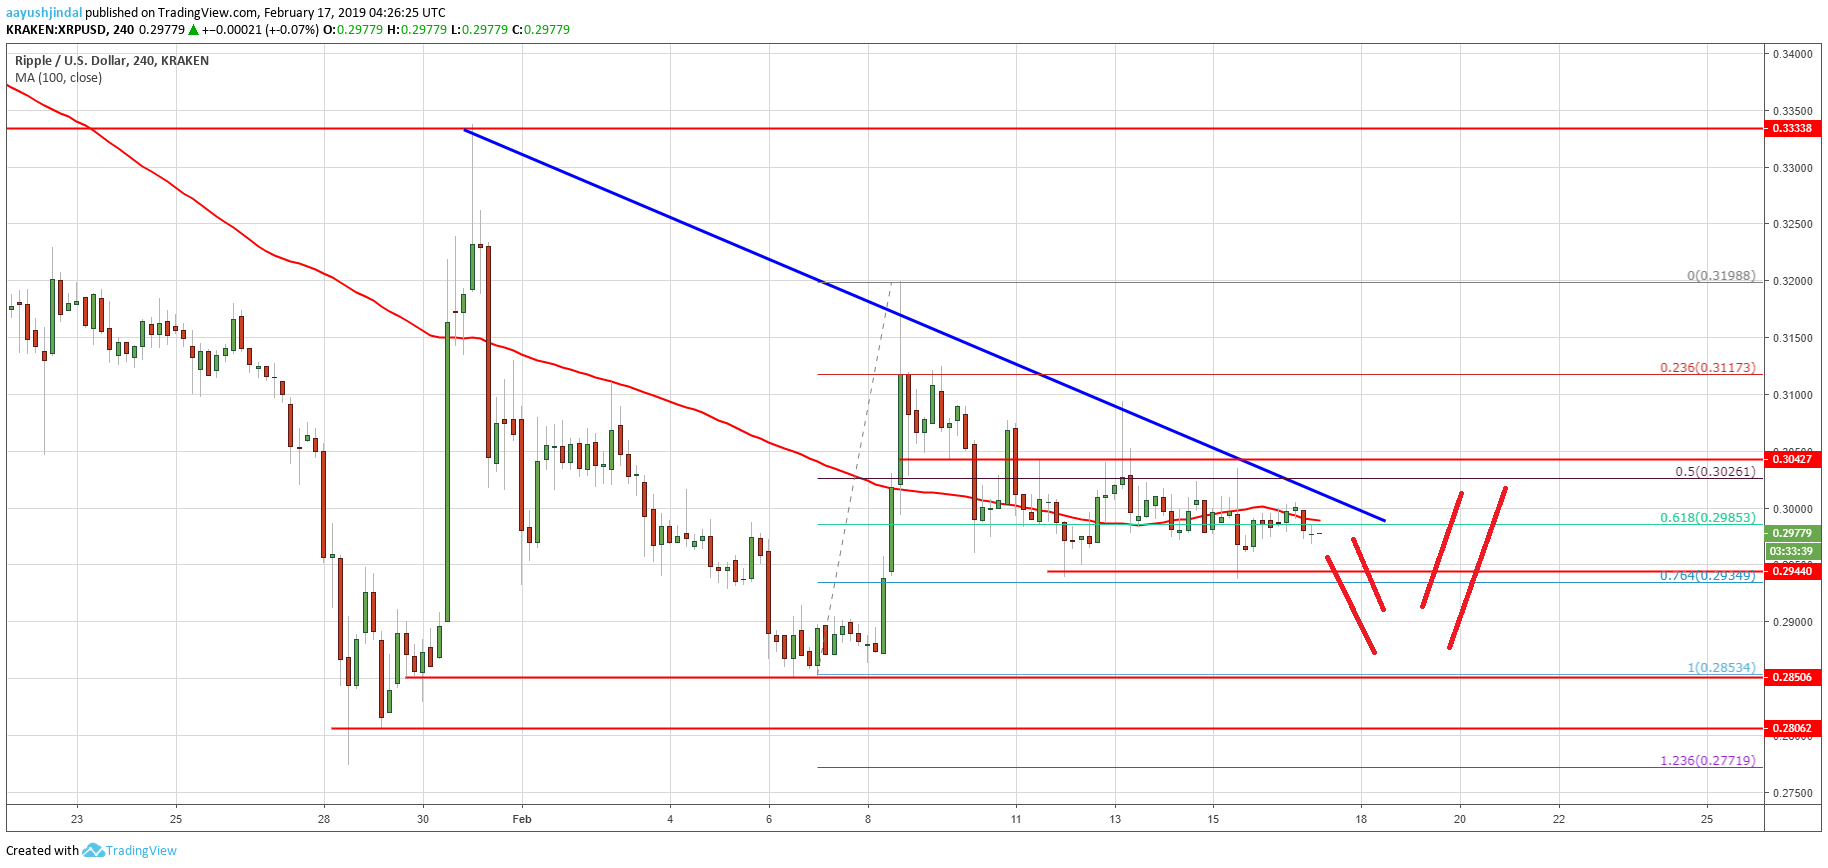

Looking at the chart, ripple price seems to be trading in a range above $0.2940 and preparing the next move. If there is a downside break below $0.2940, the price could test the $0.2850 support area. The next key support is near $0.2770 and the 1.236 Fib extension level of the last wave from the $0.2853 low to $0.3198 high. The overall price action is slightly bearish, but the $0.2940 support might continue to hold losses.
Technical Indicators
4 hours MACD – The MACD for XRP/USD is showing a few bearish signs in the bearish zone.
4 hours RSI (Relative Strength Index) – The RSI for XRP/USD just moved below the 50 level.
Major Support Level – $0.2940
Major Resistance Level – $0.3000