

- Ripple price bounced back sharply and broke the $0.3000 resistance level against the US dollar.
- There was a break above a major bearish trend line with resistance near $0.2900 on the 4-hours chart of the XRP/USD pair (data source from Kraken).
- The pair is now placed nicely above the $0.3000 support and the 100 simple moving average (4-hours).
Ripple price gained a strong bullish momentum against the US Dollar and bitcoin. XRP/USD is likely to extend the current wave towards the $0.3300 or $0.3400 resistance level.
Ripple Price Analysis
Recently, we saw a strong upward move above the $0.3250 level in ripple price against the US Dollar. However, the XRP/USD pair failed to break the $0.3340 level and declined sharply. It trimmed most its gains and revisited the $0.2850 support level. A strong support was formed near $0.2850, with a positive angle. Later, bitcoin, Ethereum, eos, litecoin and other altcoins rallied, which helped ripple to gain traction above the $0.3000 resistance. There was a solid upward move, with a close above $0.3000 and the 100 simple moving average (4-hours).
The price broke the 50% Fib retracement level of the last decline from the $0.3370 high to $0.2849 low. More importantly, there was a break above a major bearish trend line with resistance near $0.2900 on the 4-hours chart of the XRP/USD pair. The pair tested the $0.3180-0.3200 resistance area, where sellers emerged. Besides, there was a spike above the 61.8% Fib retracement level of the last decline from the $0.3370 high to $0.2849 low. Later, the price corrected lower and traded below the $0.3120 level.
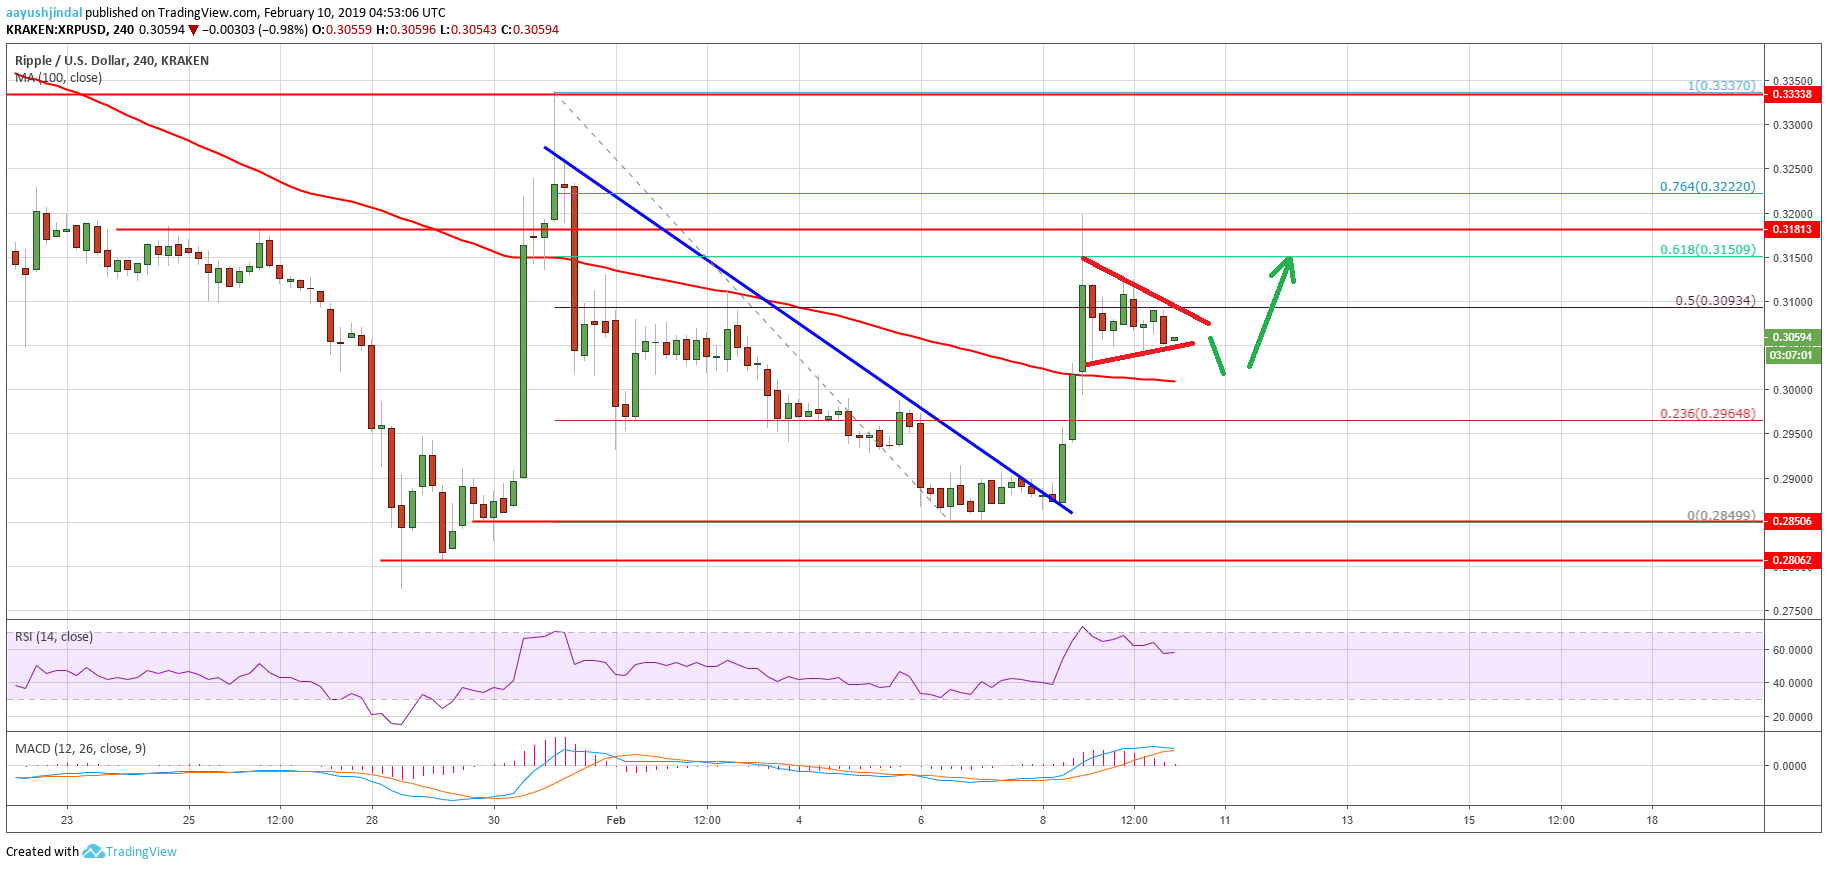

Looking at the chart, ripple price is currently trading in a short term triangle with resistance at $0.3110. There could be a few swing moves, but the price may perhaps extend gains above the $0.3180-0.3200 resistance area. The next stop for buyers could be either $0.3320 or $0.3420 in the coming sessions.
Technical Indicators
4-hours MACD – The MACD for XRP/USD is about to move back in the bearish zone.
4-hours RSI (Relative Strength Index) – The RSI for XRP/USD is currently correcting lower towards the 50 level.
Major Support Level – $0.3000
Major Resistance Level – $0.3200