
Reason to trust
How Our News is Made
Strict editorial policy that focuses on accuracy, relevance, and impartiality
Ad discliamer
Morbi pretium leo et nisl aliquam mollis. Quisque arcu lorem, ultricies quis pellentesque nec, ullamcorper eu odio.
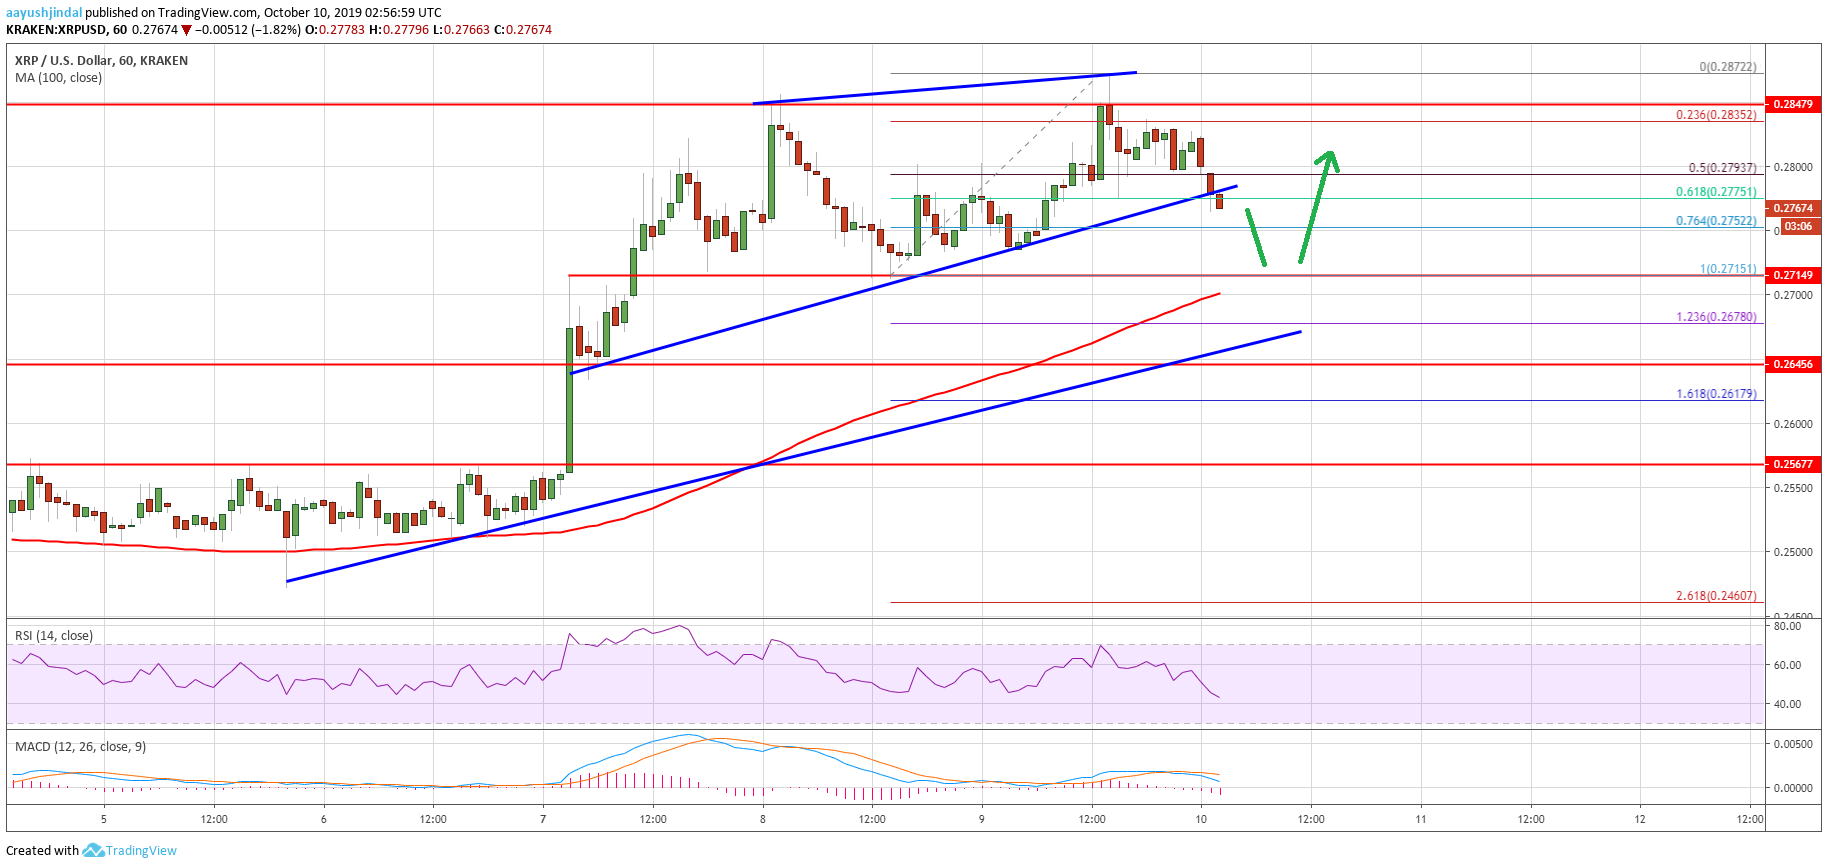
- Ripple price is currently correcting gains after setting a new weekly high at $0.2872 against the US dollar.
- The price is trading below the $0.2800 level and it might correct towards the $0.2720 support.
- There was a break below a connecting bullish trend line with support near $0.2775 on the hourly chart of the XRP/USD pair (data source from Kraken).
- The price might correct lower towards the key $0.2720 and $0.2700 support levels in the near term.
Ripple price is correcting lower against the US Dollar and bitcoin. XRP price is likely to bounce back after it revisits the key $0.2720 support area.
Ripple Price Analysis
Yesterday, there was a minor downside correction in ripple price from the $0.2850 resistance against the US Dollar. XRP price tested the key $0.2720 support area. A base was formed above $0.2700 and later the price started a fresh increase. There was a break above the $0.2750 resistance and the price remained well above the 100 hourly simple moving average.
Finally, the price surpassed the $0.2850 resistance area and traded to a new weekly high at $0.2872. Recently, the price started a downside correction below the $0.2850 and $0.2800 levels. Additionally, there was a break below the 50% Fib retracement level of the recent rise from the $0.2715 low to $0.2872 high. More importantly, there was a break below a connecting bullish trend line with support near $0.2775 on the hourly chart of the XRP/USD pair.
The pair is now testing the 61.8% Fib retracement level of the recent rise from the $0.2715 low to $0.2872 high. An immediate support is near the $0.2750 level. It coincides with the 76% Fib retracement level of the recent rise from the $0.2715 low to $0.2872 high. If there are more downsides, ripple price could revisit the main $0.2720 support area in the near term.
On the upside, an initial resistance is near the $0.2800 level. The next resistance is near the $0.2850 level, above which the price is likely to accelerate above the $0.2872 high. The next stop for the bulls in the mentioned case could be $0.2950.
Looking at the chart, ripple price is clearly correcting lower from the $0.2872 high. It might continue to decline below the $0.2750 support. However, the $0.2720 and $0.2700 are likely to hold the decline. Overall, as long as the price is above the $0.2700 level, it is likely to bounce back above $0.2820.
Technical Indicators
Hourly MACD – The MACD for XRP/USD is currently gaining strength in the bearish zone.
Hourly RSI (Relative Strength Index) – The RSI for XRP/USD is currently below the 50 level.
Major Support Levels – $0.2750, $0.2720 and $0.2700.
Major Resistance Levels – $0.2800, $0.2850 and $0.2920.


