

- Ripple price is currently correcting gains after setting a new weekly high at $0.2872 against the US dollar.
- The price is trading below the $0.2800 level and it might correct towards the $0.2720 support.
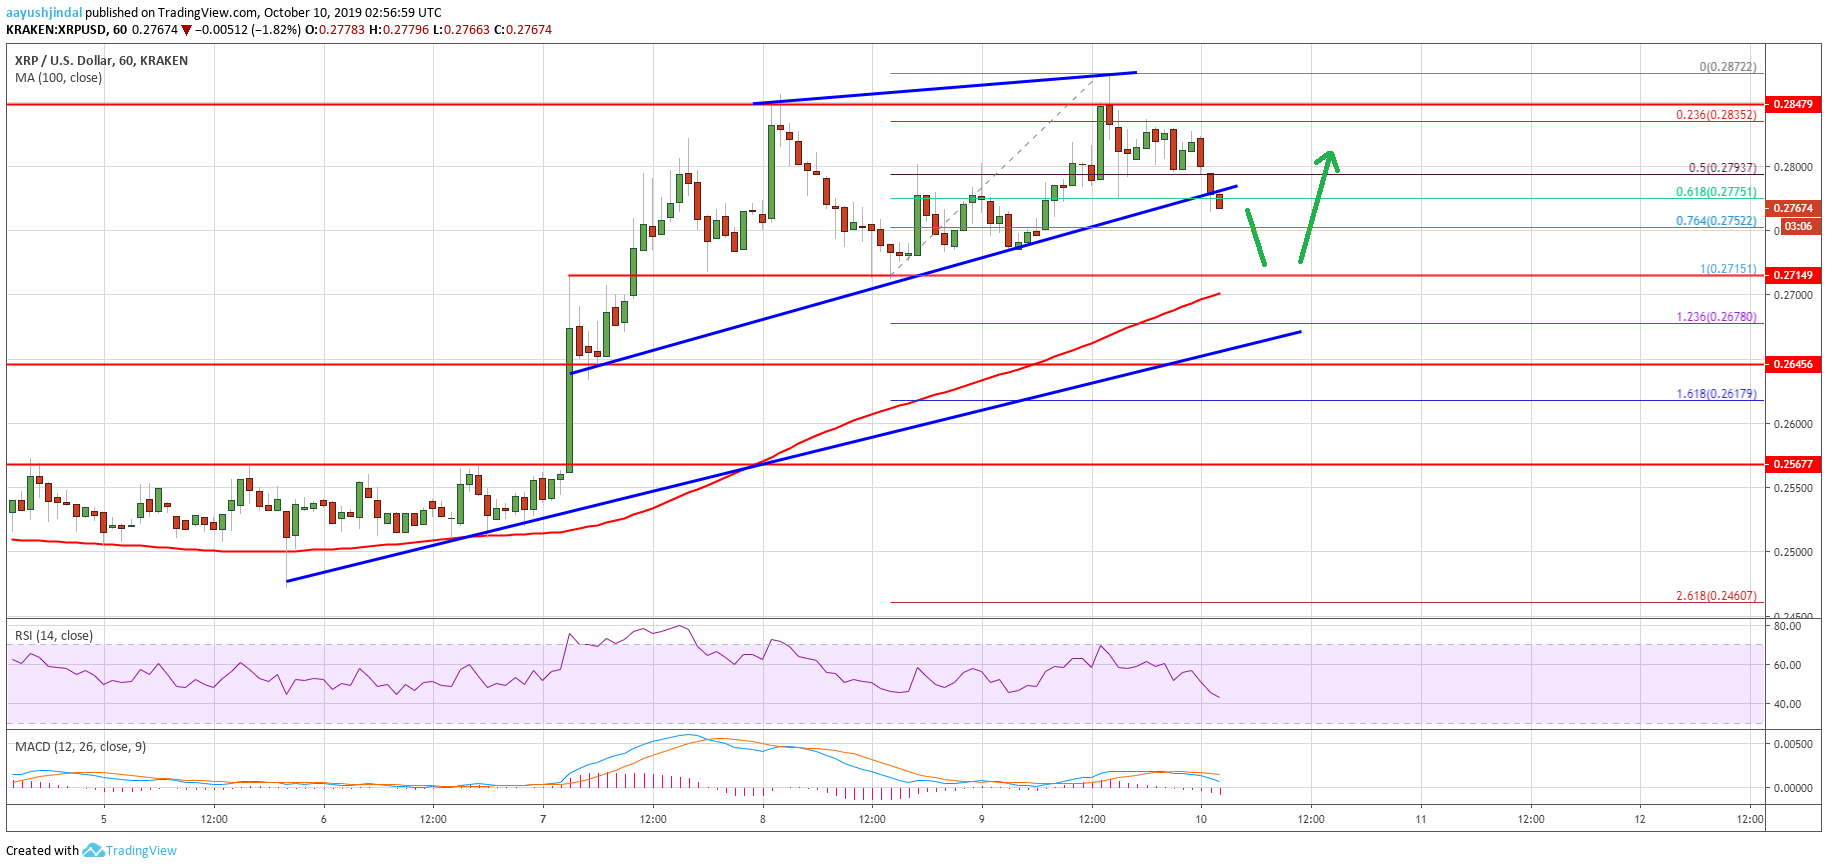
- There was a break below a connecting bullish trend line with support near $0.2775 on the hourly chart of the XRP/USD pair (data source from Kraken).
- The price might correct lower towards the key $0.2720 and $0.2700 support levels in the near term.
Ripple price is correcting lower against the US Dollar and bitcoin. XRP price is likely to bounce back after it revisits the key $0.2720 support area.
Ripple Price Analysis
Yesterday, there was a minor downside correction in ripple price from the $0.2850 resistance against the US Dollar. XRP price tested the key $0.2720 support area. A base was formed above $0.2700 and later the price started a fresh increase. There was a break above the $0.2750 resistance and the price remained well above the 100 hourly simple moving average.
Finally, the price surpassed the $0.2850 resistance area and traded to a new weekly high at $0.2872. Recently, the price started a downside correction below the $0.2850 and $0.2800 levels. Additionally, there was a break below the 50% Fib retracement level of the recent rise from the $0.2715 low to $0.2872 high. More importantly, there was a break below a connecting bullish trend line with support near $0.2775 on the hourly chart of the XRP/USD pair.
The pair is now testing the 61.8% Fib retracement level of the recent rise from the $0.2715 low to $0.2872 high. An immediate support is near the $0.2750 level. It coincides with the 76% Fib retracement level of the recent rise from the $0.2715 low to $0.2872 high. If there are more downsides, ripple price could revisit the main $0.2720 support area in the near term.
On the upside, an initial resistance is near the $0.2800 level. The next resistance is near the $0.2850 level, above which the price is likely to accelerate above the $0.2872 high. The next stop for the bulls in the mentioned case could be $0.2950.
Looking at the chart, ripple price is clearly correcting lower from the $0.2872 high. It might continue to decline below the $0.2750 support. However, the $0.2720 and $0.2700 are likely to hold the decline. Overall, as long as the price is above the $0.2700 level, it is likely to bounce back above $0.2820.
Technical Indicators
Hourly MACD – The MACD for XRP/USD is currently gaining strength in the bearish zone.
Hourly RSI (Relative Strength Index) – The RSI for XRP/USD is currently below the 50 level.
Major Support Levels – $0.2750, $0.2720 and $0.2700.
Major Resistance Levels – $0.2800, $0.2850 and $0.2920.