
- Ripple price struggled to recover above the $0.3250 resistance and extended losses against the US dollar.
- The price traded below the $0.3100 support and traded close to the $0.3025 level.
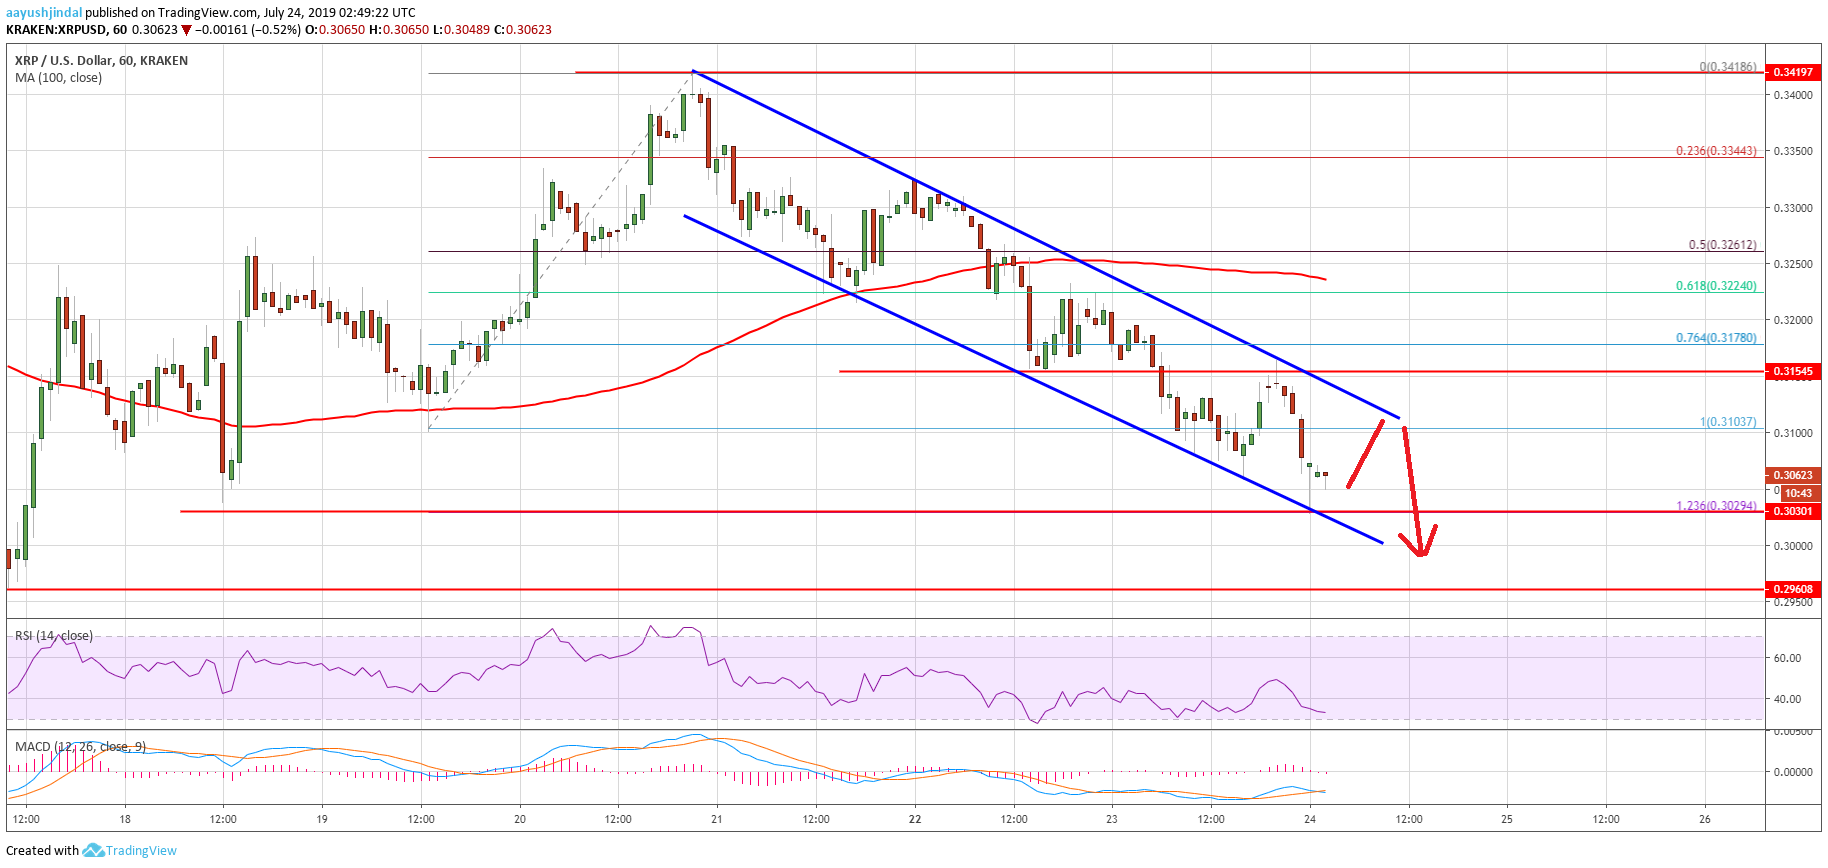
- There is a significant declining channel forming with resistance near $0.3120 on the hourly chart of the XRP/USD pair (data source from Kraken).
- The price remains at a risk of more losses and it could even test the $0.2960 support level.
Ripple price is gaining bearish momentum against the US Dollar and bitcoin. XRP price could decline further unless the bulls push the price back above the $0.3150 resistance.
Ripple Price Analysis
In the past two days, there were steady losses in bitcoin, Ethereum and ripple against the US Dollar. The XRP/USD pair failed to stay above the $0.3250 and $0.3200 support levels. Moreover, there was a break below the $0.3100 support level. The decline was such that the price even traded below the 76.4% Fib retracement level of the upward move from the $0.3103 low to $0.3420 swing high.
Moreover, the price settled below the 100 hourly simple moving average and spiked below the $0.3060 level. The price is currently trading near the $0.3030 level and tested the 1.236 Fib extension level of the upward move from the $0.3103 low to $0.3420 swing high. More importantly, there is a significant declining channel forming with resistance near $0.3120 on the hourly chart of the XRP/USD pair.
On the upside, the main resistance levels are $0.3100 and $0.3150. A successful close above the $0.3150 resistance is needed for a decent recovery. The next major resistance above $0.3150 is near the $0.3220 and $0.3225 levels. However, the price must break the $0.3250 resistance and the 100 hourly SMA to move back in a positive zone.
On the downside, an immediate support is near the $0.3030 and $0.3025 levels. If there is a downside break below $0.3025, the price could even break the $0.3000 support. The next important support is near the $0.2960 level. If there are more losses, the price might test the 1.618 Fib extension level of the upward move from the $0.3103 low to $0.3420 swing high.
Looking at the chart, ripple price is clearly trading in a bearish zone below $0.3120 and $0.3150. To start a fresh increase, the price must accelerate above the $0.3150 level. If not, there is a risk of more downsides below $0.3000.
Technical Indicators
Hourly MACD – The MACD for XRP/USD is currently gaining momentum in the bearish zone.
Hourly RSI (Relative Strength Index) – The RSI for XRP/USD is now well below the 40 level.
Major Support Levels – $0.3025, $0.3000 and $0.2960.
Major Resistance Levels – $0.3100, $0.3120 and $0.3150.