

- Ripple price remained supported above $0.3030 and climbed higher against the US dollar.
- The price broke the key $0.3150 resistance to move into a positive zone and start a recovery.
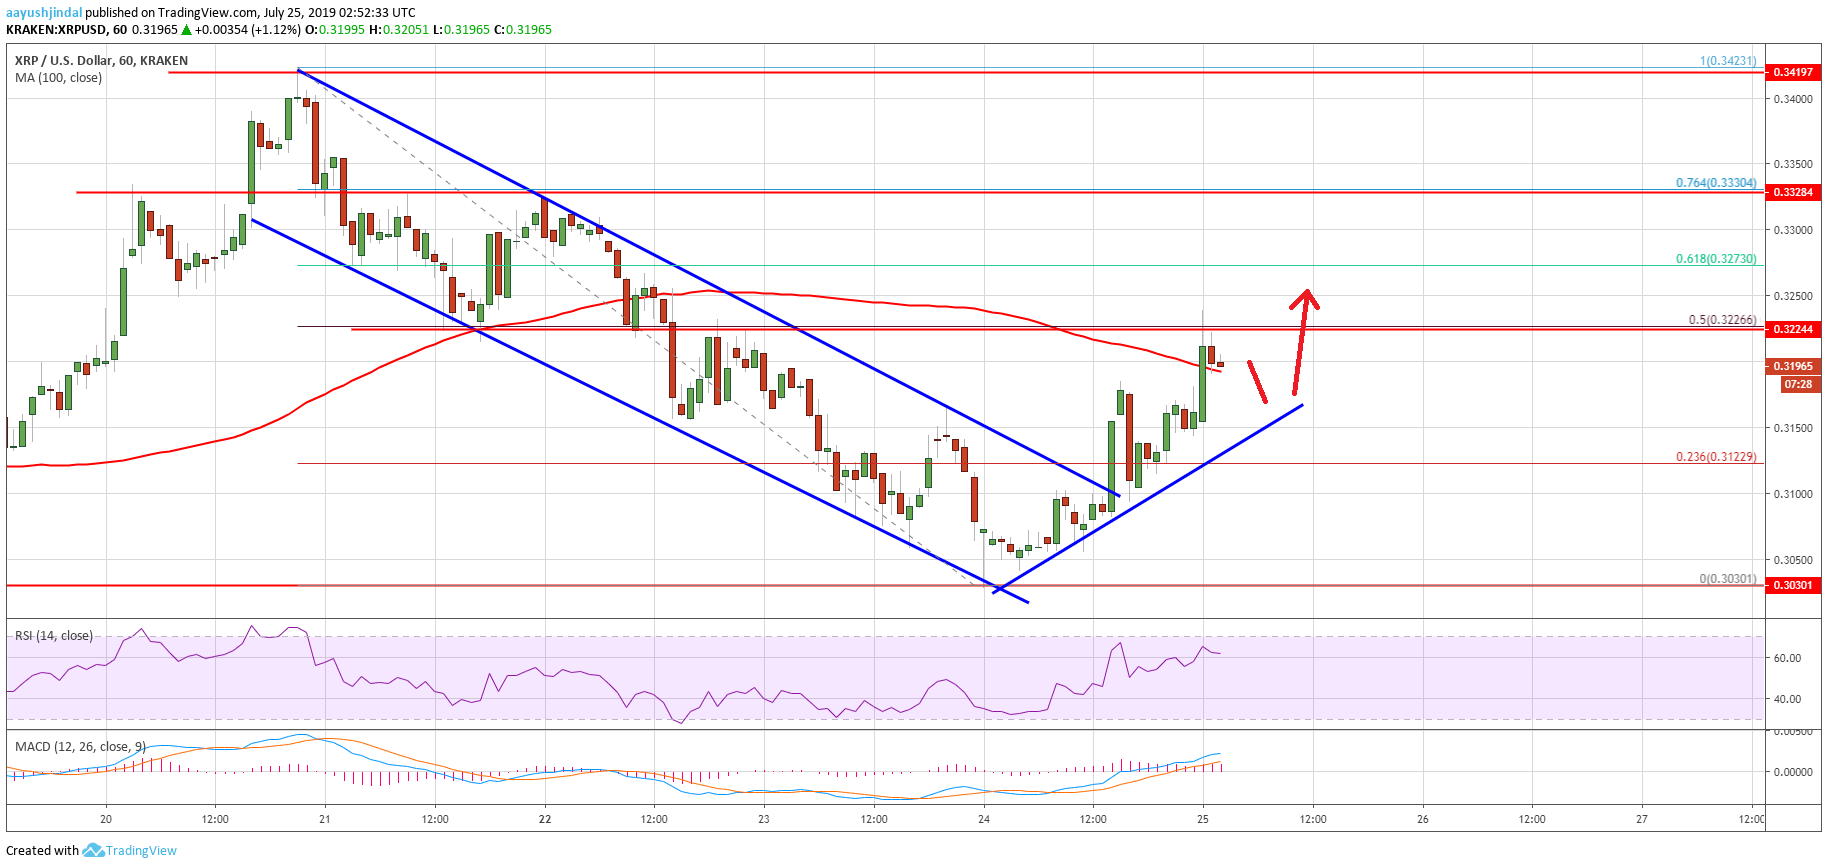
- Yesterday’s highlighted major declining channel was breached with resistance near $0.3100 on the hourly chart of the XRP/USD pair (data source from Kraken).
- The price is currently struggling near $0.3220, but it is likely to continue higher in the coming sessions.
Ripple price is showing positive signs against the US Dollar, similar to bitcoin and Ethereum. XRP price could accelerate gains if it settles above the $0.3220 resistance area.
Ripple Price Analysis
After three days of losses, ripple price found support above the $0.3000 level against the US Dollar. The XRP/USD pair traded as low as $0.3030 and recently started a solid upward move. There was a break above the $0.3080 and $0.3100 resistance levels to start the recent recovery. Moreover, the price traded above the 23.6% Fib retracement level of the downward move from the $0.3421 high to $0.3030 low.
Additionally, yesterday’s highlighted major declining channel was breached with resistance near $0.3100 on the hourly chart of the XRP/USD pair. The pair even broke the $0.3200 resistance and the 100 hourly simple moving average. However, the price is now struggling to break the $0.3200 and $0.3220 resistance levels. Moreover, the 50% Fib retracement level of the downward move from the $0.3421 high to $0.3030 low is also acting as a resistance.
If there is an upside break above the $0.3220 and $0.3230 levels, the price could accelerate higher. The next resistance could be $0.3280 or the 61.8% Fib retracement level of the downward move from the $0.3421 high to $0.3030 low. The main resistance on the upside is near the $0.3330, above which the price is likely to accelerate towards the $0.3420 level.
Conversely, if there is a downside correction, the price might find bids near the $0.3180 and $0.3160 levels. There is also a connecting bullish trend line forming with support near $0.3155 on the same chart. If there is a downside break below the $0.3150 support, the price could decline towards the $0.3100 support.
Looking at the chart, ripple price is showing bullish signs above the $0.3100 and $0.3150 levels. Having said that, the price must surpass the $0.3220 and $0.3230 resistance levels to continue higher towards $0.3330 and $0.3400 in the near term.
Technical Indicators
Hourly MACD – The MACD for XRP/USD is currently gaining pace in the bullish zone.
Hourly RSI (Relative Strength Index) – The RSI for XRP/USD is showing positive signs and is currently near 60.
Major Support Levels – $0.3180, $0.3150 and $0.3100.
Major Resistance Levels – $0.3220, $0.3280 and $0.3330.