

- Ripple price struggled to climb above the $0.3060 level and recently declined against the US dollar.
- The price is trading with a bearish angle below the $0.3020 and $0.3010 levels.
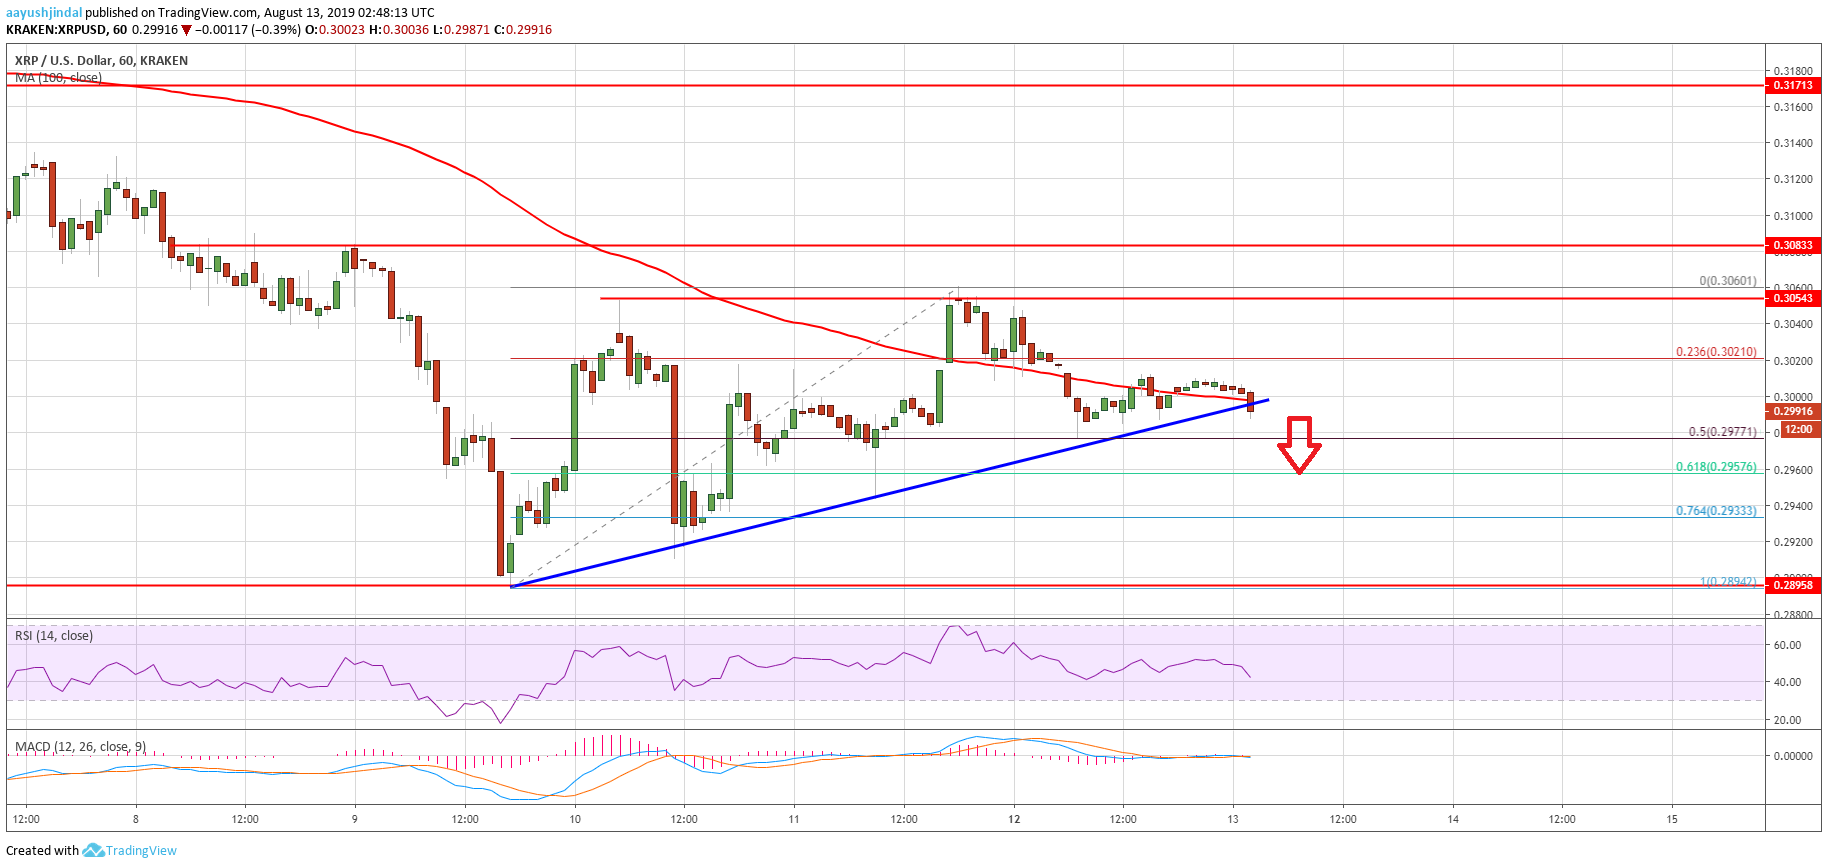
- XRP/USD is about to break a connecting bullish trend line with support near $0.2995 on the hourly chart (data source from Kraken).
- The pair is likely to accelerate losses if it settles below $0.3000 and the 100 hourly SMA.
Ripple price is struggling to continue higher against the US Dollar, while bitcoin is ranging. XRP price might revisit the $0.2920 level before it could climb again.
Ripple Price Analysis
Yesterday, we saw a decent upside correction in ripple price above $0.3000 against the US Dollar. The XRP/USD pair climbed above the $0.3020 resistance and the 100 hourly simple moving average. Moreover, the price spiked above the $0.3050 level, but it failed to climb above the $0.3060 level. It seems like the negative sentiment around bitcoin and Ethereum stopped yesterday’s recovery.
XRP price is now trading with a bearish angle below the $0.3020 support. Additionally, there was a break below the 23.6% Fib retracement level of the recent recovery from the $0.2894 low to $0.3060 high. At the moment, the price is about to break a connecting bullish trend line with support near $0.2995 on the hourly chart. Therefore, there is a risk of more losses below $0.3000 and $0.2990 in the near term.
An immediate support is near the $0.2977 level. It represents the 50% Fib retracement level of the recent recovery from the $0.2894 low to $0.3060 high. Having said that, the price action suggests that the price could extend its decline below the $0.2980 and $0.2960 level. Therefore, it could even spike below $0.2950 to test the $0.2920 support level. Conversely, if there is no close below $0.3000, the price could climb higher.
An immediate resistance is near the $0.3020 level, above which the price may perhaps retest the $0.3060 high. Moreover, if there is a break above the $0.3060 high, the price could resume its recovery towards the $0.3100 and $0.3120 levels. The main resistance on the upside is near the $0.3170-0.3180 area.
Looking at the chart, ripple price is clearly struggling to continue higher and is testing the key $0.3000 support area. If the bulls continue to struggle, there are high chances of a fresh decline below the $0.2980 and $0.2950 levels. The main supports on the downside are near $0.2920 and $0.2900.
Technical Indicators
Hourly MACD – The MACD for XRP/USD is gaining momentum in the bearish zone.
Hourly RSI (Relative Strength Index) – The RSI for XRP/USD is currently well below the 50 level.
Major Support Levels – $0.2980, $0.2950 and $0.2920.
Major Resistance Levels – $0.3020, $0.3060 and $0.3100.