

- Ripple price traded higher recently above the $0.3250 resistance level against the US dollar.
- The price topped near the $0.3320 resistance and recently declined heavily below $0.3200.
- There is a connecting bullish trend line forming with support near $0.3160 on the hourly chart of the XRP/USD pair (data source from Kraken).
- The price could either bounce back above $0.3200 or it might extend losses below the $0.3150 support.
Ripple price is struggling to hold a key support against the US Dollar, while bitcoin is trading with a positive bias. XRP price might bounce back as long as above $0.3150.
Ripple Price Analysis
Earlier this week, ripple price popped above the $0.3200 resistance levels against the US Dollar after Ethereum and bitcoin gained bullish momentum. The XRP/USD pair even broke the $0.3250 resistance and settled above the 100 hourly simple moving average. Moreover, there was a break above the $0.3300 resistance level. However, the upward move was capped by the $0.3320 resistance area.
A swing high was formed near $0.3318 and the price recently started a major decline. It broke the $0.3250 support level. Moreover, there was a break below the 50% Fib retracement level of the upward move from the $0.3122 low to $0.3318 high. The price is now trading below the $0.3200 support level. More importantly, it seems like the bulls are strolling to protect the $0.3180 support level.
An immediate support is near the $0.3168 level. It represents the 76.4% Fib retracement level of the upward move from the $0.3122 low to $0.3318 high. Additionally, there is a connecting bullish trend line forming with support near $0.3160 on the hourly chart of the XRP/USD pair. The trend line support and the $0.3150 level are key supports. Therefore, if there is a downside break below the $0.3150 support, the price could decline back to $0.3100.
On the upside, the $0.3220 level is an initial resistance. The main resistance is near the $0.3235 level, above which the price is likely to test the $0.3300 and $0.3320 resistance levels. Any further gains might push the price towards the $0.3400 level.
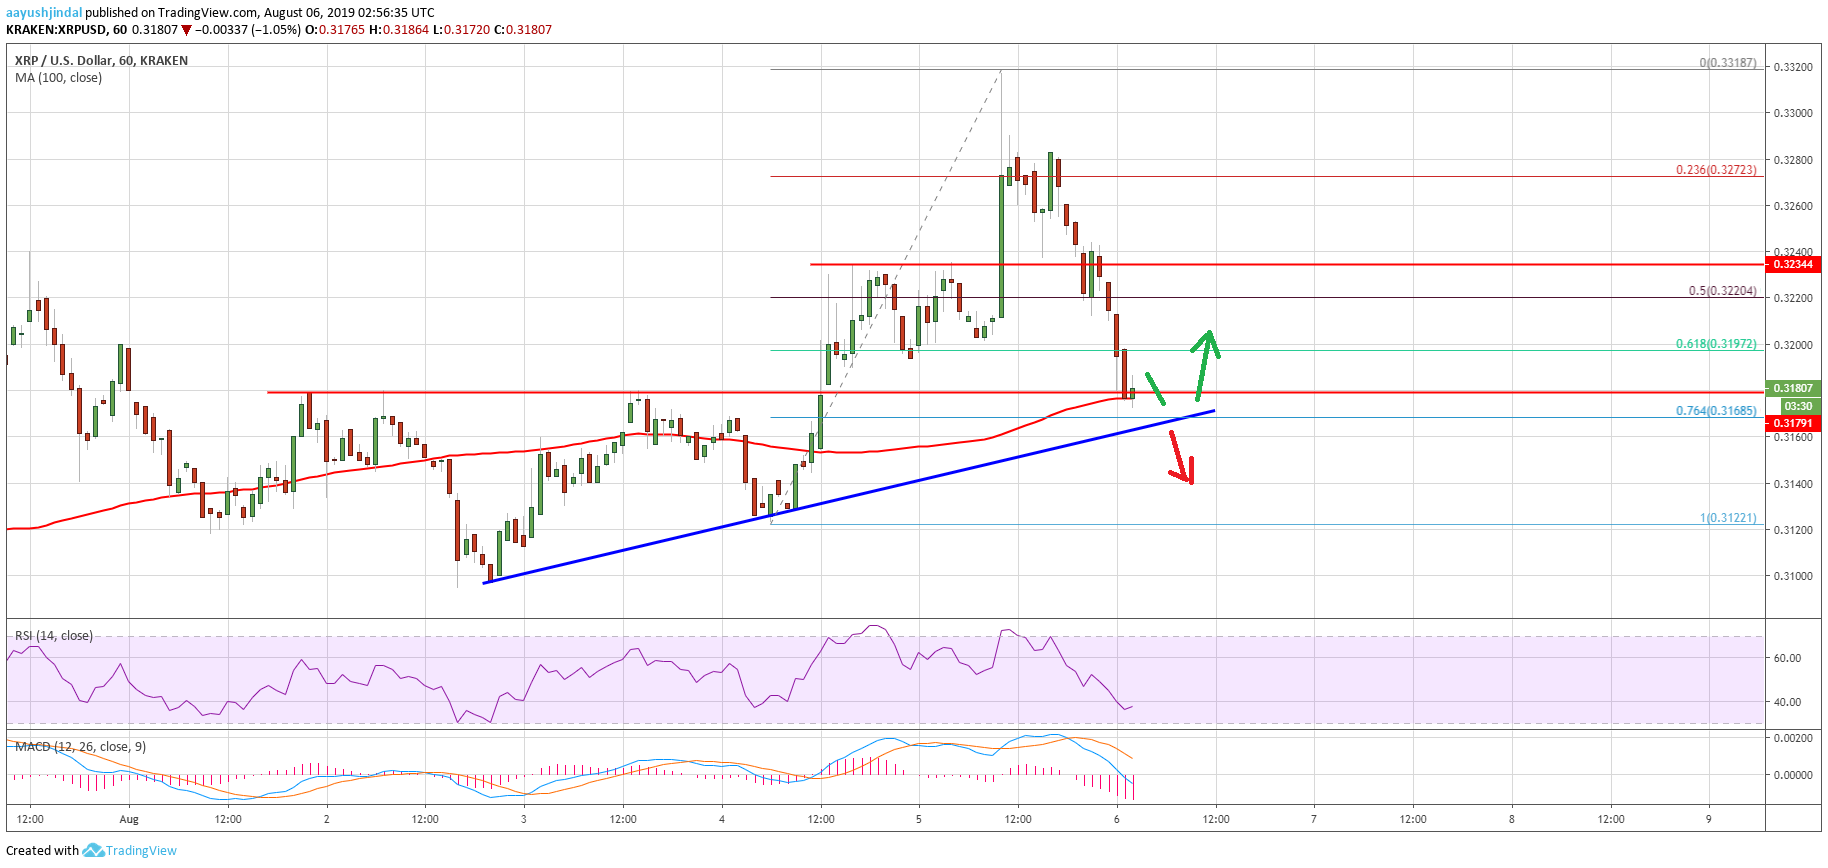
Looking at the chart, ripple price is clearly trading near a few important supports such as $0.3180, $0.3160 and $0.3150. Therefore, a successful close below $0.3150 might push the price back in a bearish zone. Conversely, the price could bounce back above $0.3220 and $0.3235 levels in the near term.
Technical Indicators
Hourly MACD – The MACD for XRP/USD is placed heavily in the bearish zone.
Hourly RSI (Relative Strength Index) – The RSI for XRP/USD is slowly correcting higher from the 35 level.
Major Support Levels – $0.3180, $0.3160 and $0.3150.
Major Resistance Levels – $0.3200, $0.3220 and $0.3235.