

- Ripple price started a downside correction after rallying towards $0.4630 against the US dollar.
- The price declined sharply and broke the $0.4400 and $0.4300 support levels.
- This week’s followed bullish trend line was breached with support near $0.4365 on the hourly chart of the XRP/USD pair (data source from Kraken).
- The pair is currently holding the $0.4200 support level and is trading near a key resistance area.
Ripple price is currently struggling to hold gains against the US Dollar and bitcoin. XRP is likely to climb higher again as long as the $0.4200 support area is intact in the near term.
Ripple Price Analysis
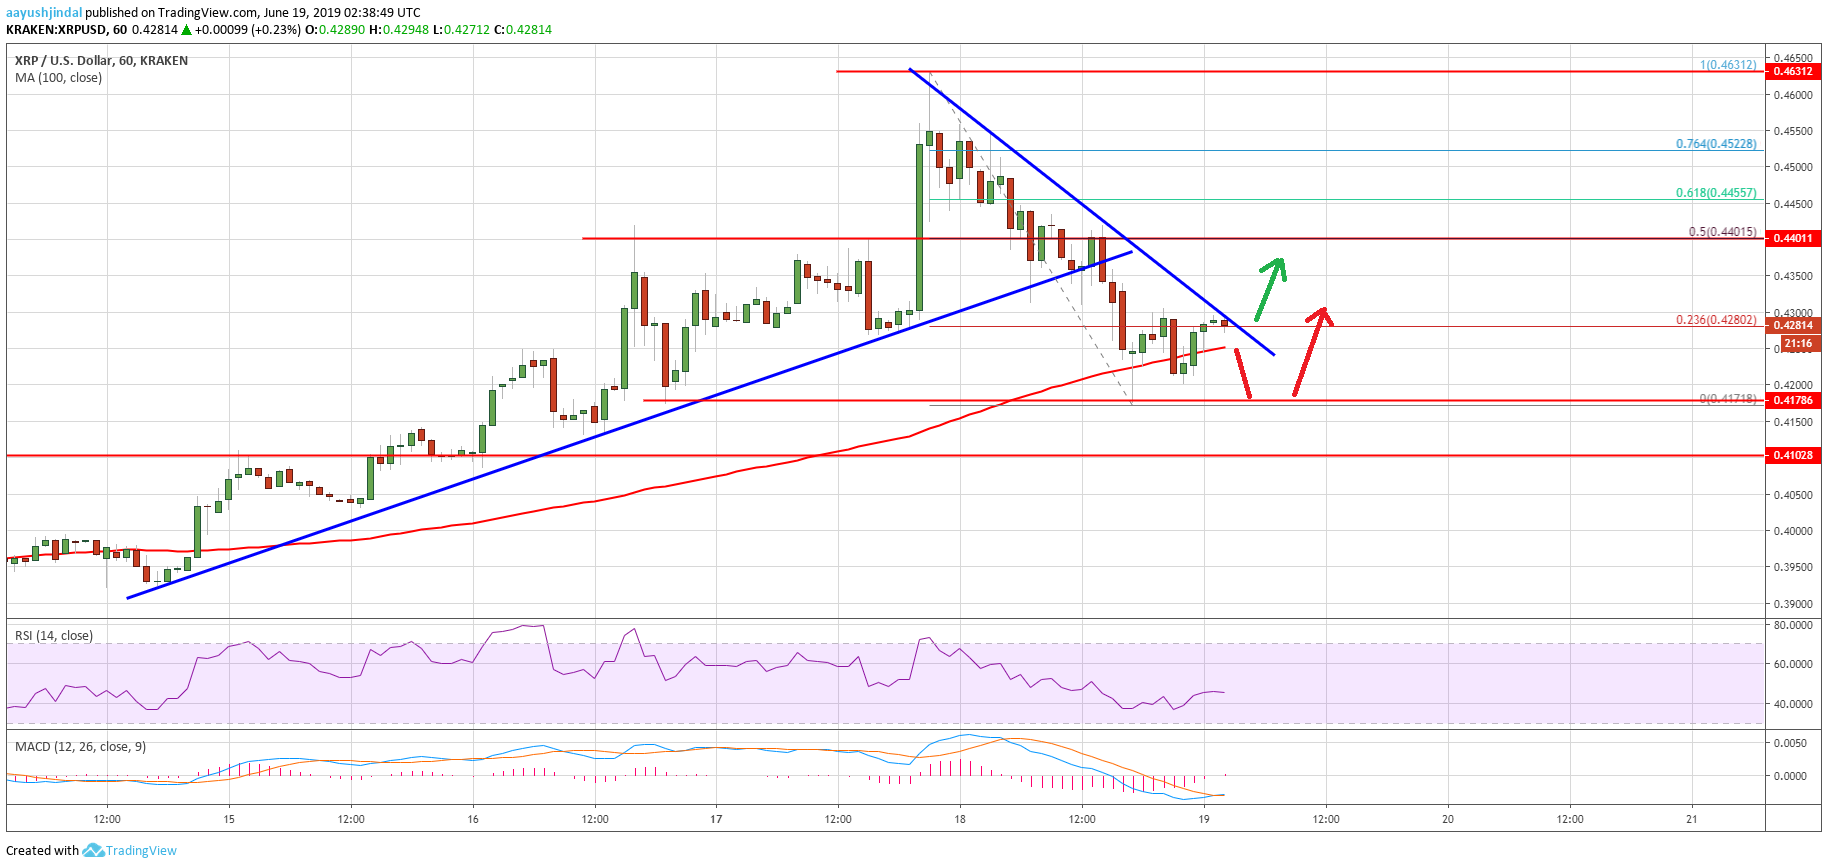
Yesterday, we saw a sharp rise in ripple price above the $0.4400 resistance against the US Dollar. The XRP/USD pair even broke the $0.4500 resistance and rallied above $0.4600. Finally, a new weekly high was formed near $0.4631 and the price recently started a downside correction. There was a break below the $0.4500 and $0.4400 support levels. Moreover, the price traded below the $0.4300 level and the 100 hourly simple moving average.
The price tested the $0.4200 support level and formed a low at $0.4171. It is currently correcting higher above the $0.4250 level. Moreover, it is testing the 23.6% Fib retracement level of the recent decline from the $0.4631 high to $0.4171 low. Besides, there is a connecting bearish trend line forming with resistance at $0.4300 on the hourly chart of the XRP/USD pair.
If the pair surpassed the trend line and $0.4300, there could be a fresh increase. The next key resistance is near the $0.4400 level. Furthermore, the 50% Fib retracement level of the recent decline from the $0.4631 high to $0.4171 low is also near $0.4400.
Conversely, if the price fails to climb above $0.4300, it could decline once again. An immediate support is near the $0.4200 level, below which the price could test the $0.4100 support. The main support is near the $0.4000 level, below which the price is likely to move back in a bearish zone.
Looking at the chart, ripple price is clearly struggling to hold gains above $0.4200. It must climb above $0.4300 and $0.4320 to avoid any further losses. To start a fresh rally, the price must surpass the $0.4400 barrier. On the other hand, if the price fails to stay above $0.4200 or $0.4100, there are chances of an extended decline.
Technical Indicators
Hourly MACD – The MACD for XRP/USD is likely to move back in the bullish zone.
Hourly RSI (Relative Strength Index) – The RSI for XRP/USD is currently correcting higher, but it is still below 50.
Major Support Levels – $0.4200, $0.4100 and $0.4000.
Major Resistance Levels – $0.4300, $0.4320 and $0.4400.