

- Ripple price formed a decent support near the $0.2915 level and climbed higher against the US dollar.
- The price broke the $0.2950 resistance and it looks set to gain bullish momentum in the near term.
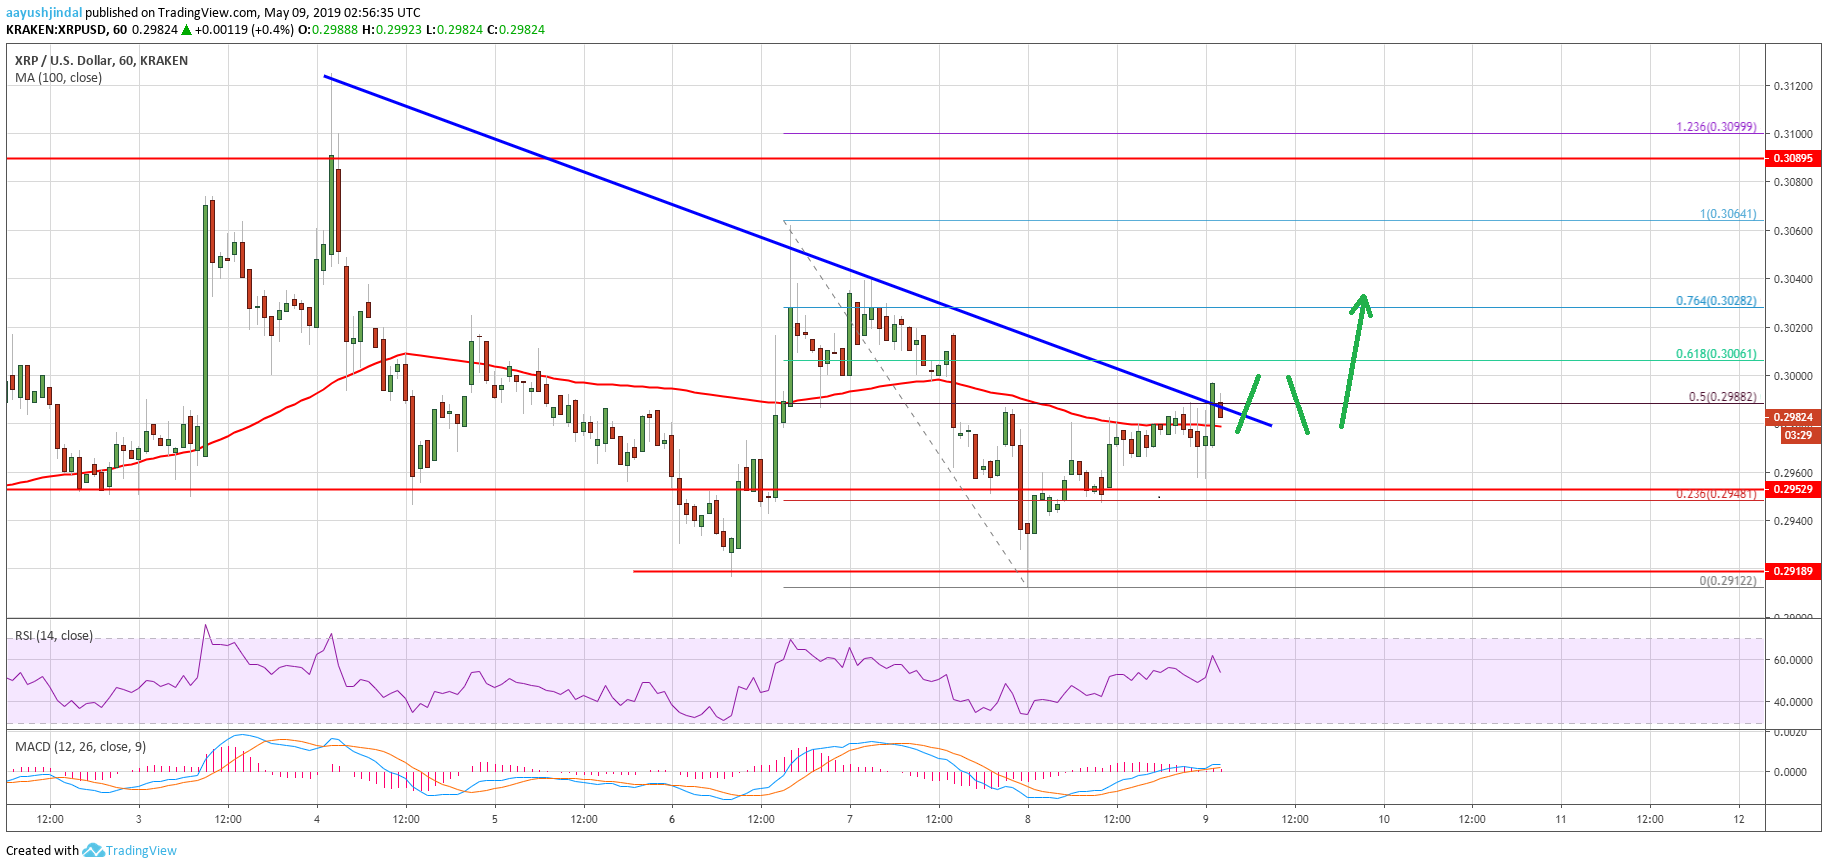
- Yesterday’s highlighted bearish trend line is about to give way with resistance near $0.2988 on the hourly chart of the XRP/USD pair (data source from Kraken).
- The pair could start a strong upward move if it breaks the $0.3000 and $0.3020 resistance levels.
Ripple price is slowly recovering higher against the US Dollar, while bitcoin and Ethereum gain traction. XRP is likely to accelerate once it clears the key $0.3000 resistance level in the near term.
Ripple Price Analysis
Yesterday, there was a downside extension in ripple price below the $0.3000 support against the US Dollar. The XRP/USD pair even broke the $0.2950 support level and traded as low as $0.2912. There was a close below the $0.2950 level and the 100 hourly simple moving average. However, the price found support near $0.2910 and $0.2920. Besides, the recent rise in bitcoin price helped altcoins in staging a decent comeback.
XRP price recovered above the $0.2950 resistance, and the 23.6% Fib retracement level of the last slide from the $0.3064 high to $0.2912 low. It even climbed above the $0.2980 level and the 100 hourly SMA. At the moment, yesterday’s highlighted bearish trend line is about to give way with resistance near $0.2988 on the hourly chart of the XRP/USD pair. The 50% Fib retracement level of the last slide from the $0.3064 high to $0.2912 low is also acting as a resistance. Once there is a proper break above the $0.2988 and $0.3000 resistances, there could be more gains. The next key resistance is at $0.3020, above which the price could retest the $0.3050 resistance.
On the other hand, if there is no upside break above $0.3000, the price might drop back towards $0.2950. If the bulls fail to defend the $0.2950 support, there could be a sharp drop back towards the $0.2910 level. Any further losses could accelerate declines below the $0.2900 support level.

Looking at the chart, ripple price is likely to break the trend line and $0.3000 in the near term. The current price action is positive and signaling an upside break above $0.3020. Having said that, there might be a couple of swing moves before the price climbs towards the $0.3050 level.
Technical Indicators
Hourly MACD – The MACD for XRP/USD is slowly gaining momentum in the bullish zone.
Hourly RSI (Relative Strength Index) – The RSI for XRP/USD recently tested the 60 level and it is currently correcting lower.
Major Support Levels – $0.2950, $0.2920 and $0.2900.
Major Resistance Levels – $0.2988, $0.3000 and $0.3020.