

- Ripple price failed to hold the key $0.2850 support and extended its decline against the US dollar.
- The price is currently correcting higher, but it is likely to face sellers near $0.2850 and $0.2880.
- This week’s followed key bullish trend line was breached with support near $0.2855 is intact on the hourly chart of the XRP/USD pair (data source from Kraken).
- The price is now facing a strong resistance near the $0.2860 and $0.2880 levels.
Ripple price is struggling to hold gains against the US Dollar and bitcoin. XRP price is currently under pressure and it could continue to move down towards $0.2750.
Ripple Price Analysis
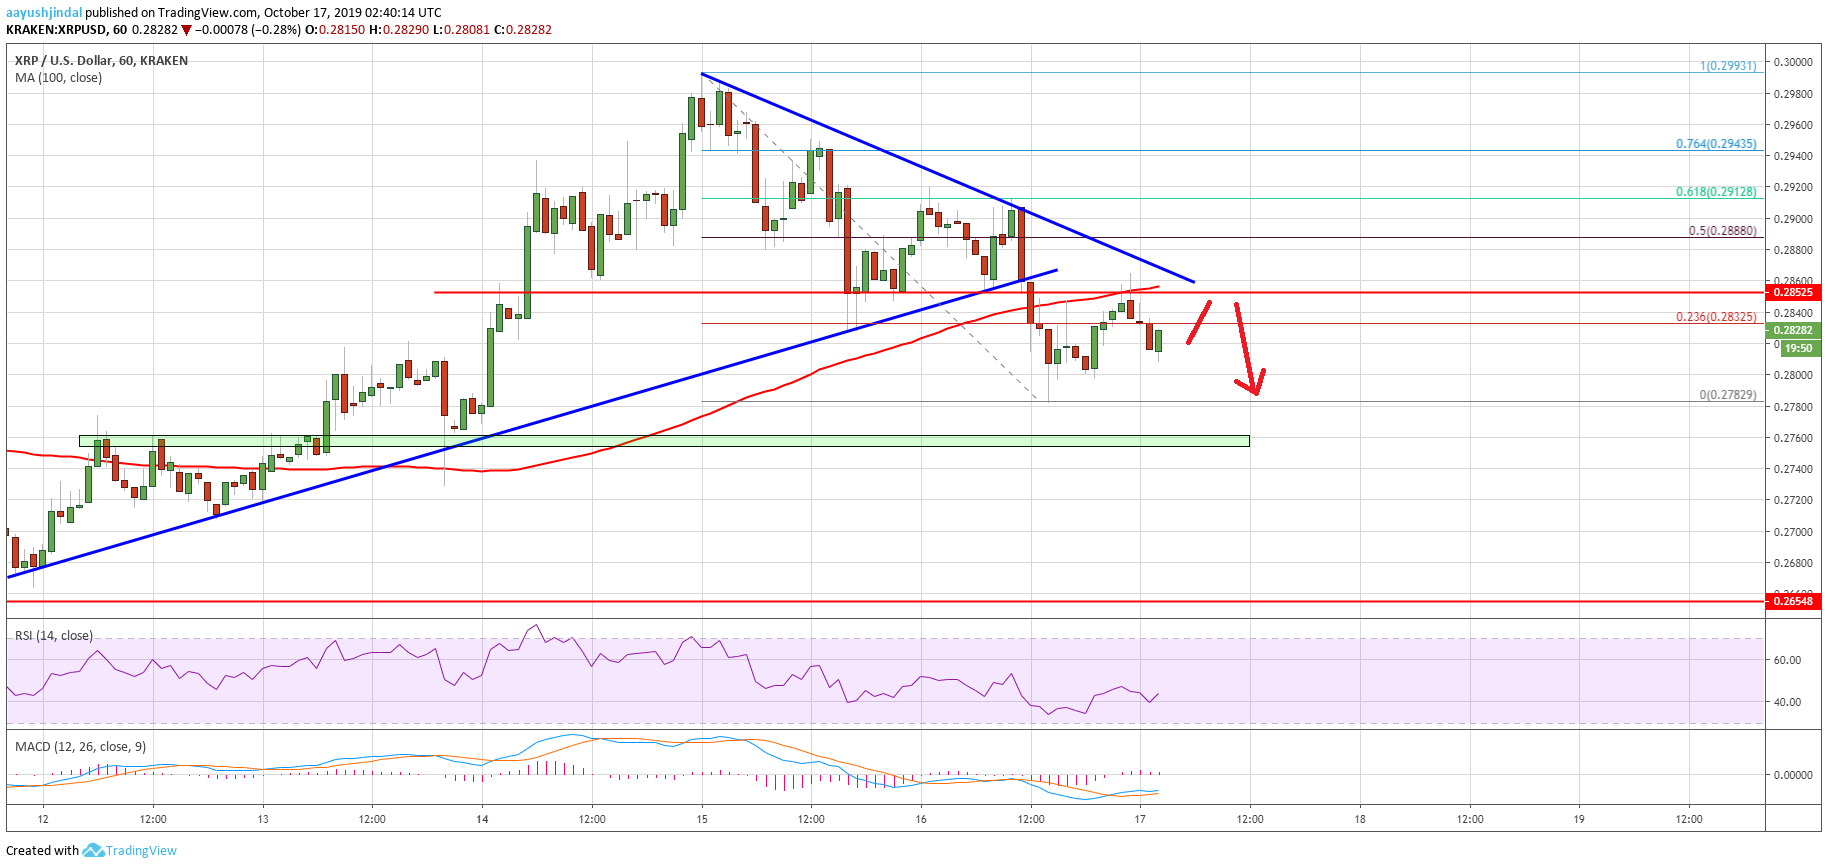
In the past few hours, there was an increase in selling for bitcoin, ripple and Ethereum against the US Dollar. XRP price failed to hold a couple of important supports such as $0.2880 and $0.2850. As a result, there was a bearish break below the $0.2850 support area. Moreover, there was a close below the $0.2850 support and the 100 hourly simple moving average.
More importantly, this week’s followed key bullish trend line was breached with support near $0.2855 is intact on the hourly chart of the XRP/USD pair. The pair even spiked below $0.2800 and traded as low as $0.2782. Recently, the price started an upside correction above the $0.2800 level. Additionally, there was a break above the 23.6% Fib retracement level of the recent drop from the $0.2992 high to $0.2782 low.
However, the previous support near the $0.2850 level is acting as a resistance. Moreover, the 100 hourly SMA is preventing recovery above $0.2860. There is also a connecting bearish trend line forming with resistance near $0.2860 on the same chart. Therefore, an upside break above the $0.2860 and $0.2880 is needed for a fresh increase in ripple in the near term.
On the downside, an immediate support is near the $0.2800 level. If the price fails to hold the $0.2800 support, there are chances of an extended decline below $0.2780. The next major support is near the $0.2750 level, below which the price could even trade towards the $0.2720 level.
Looking at the chart, ripple price seems to be struggling to clear the $0.2850 resistance. If the bulls continue to face resistance near $0.2860 and $0.2850, the price could resume its decline. Conversely, a successful break above $0.2860 may perhaps push the price towards the $0.2920 level in the near term.
Technical Indicators
Hourly MACD – The MACD for XRP/USD is struggling to stay in the bullish zone.
Hourly RSI (Relative Strength Index) – The RSI for XRP/USD is currently just above the 40 level.
Major Support Levels – $0.2800, $0.2780 and $0.2750.
Major Resistance Levels – $0.2850, $0.2860 and $0.2920.