
- Ripple price rallied recently above the $0.2220 resistance, but failed near $0.2265 against the US dollar.
- The price currently declining and it is approaching the pre-rally level near $0.2100.
- There is a new bearish trend line forming with resistance near $0.2210 on the hourly chart of the XRP/USD pair (data source from Kraken).
- Ethereum is also down and moving towards the $142 support area.
Ripple price is still trading in downtrend despite the recent rally against the US Dollar, similar to bitcoin. XRP price is likely to revisit the $0.2000 support in the near term.
Ripple Price Analysis
After tagging the $0.2100 support area, ripple started a strong rise above $0.2200 resistance area against the US Dollar. Moreover, XRP price rallied above the $0.2220 resistance and the 100 hourly simple moving average.
However, the $0.2265 and $0.2270 levels acted as a strong barrier. A swing high was formed near $0.2277 and the price started trimming gains. It traded below the $0.2180 level and the 100 hourly simple moving average.
Besides, the price broke the 50% Fib retracement level of the recent rally from the $0.2097 low to $0.2277 high. Clearly, ripple price made a failed attempt to start a strong recovery above the $0.2220 and $0.2265 levels.
It is now trading below the 76.4% Fib retracement level of the recent rally from the $0.2097 low to $0.2277 high. Therefore, there is a risk of a downside break below the $0.2100 support area in the near term.
In the mentioned case, the price could even trade below the $0.2050 support area. The main support is near the $0.2000 level, where the bulls are likely to take a stand.
Any further losses could push ripple in a nasty downtrend towards $0.1900 or may be $0.1850. On the upside, there are many resistances near the $0.2150 and $0.2180 levels.
Additionally, there is a new bearish trend line forming with resistance near $0.2210 on the hourly chart of the XRP/USD pair. An intermediate resistance is near $0.2200 and the 100 hourly SMA. If the price climbs above the $0.2200 and $0.2210 resistance levels, it could move into a bullish zone.
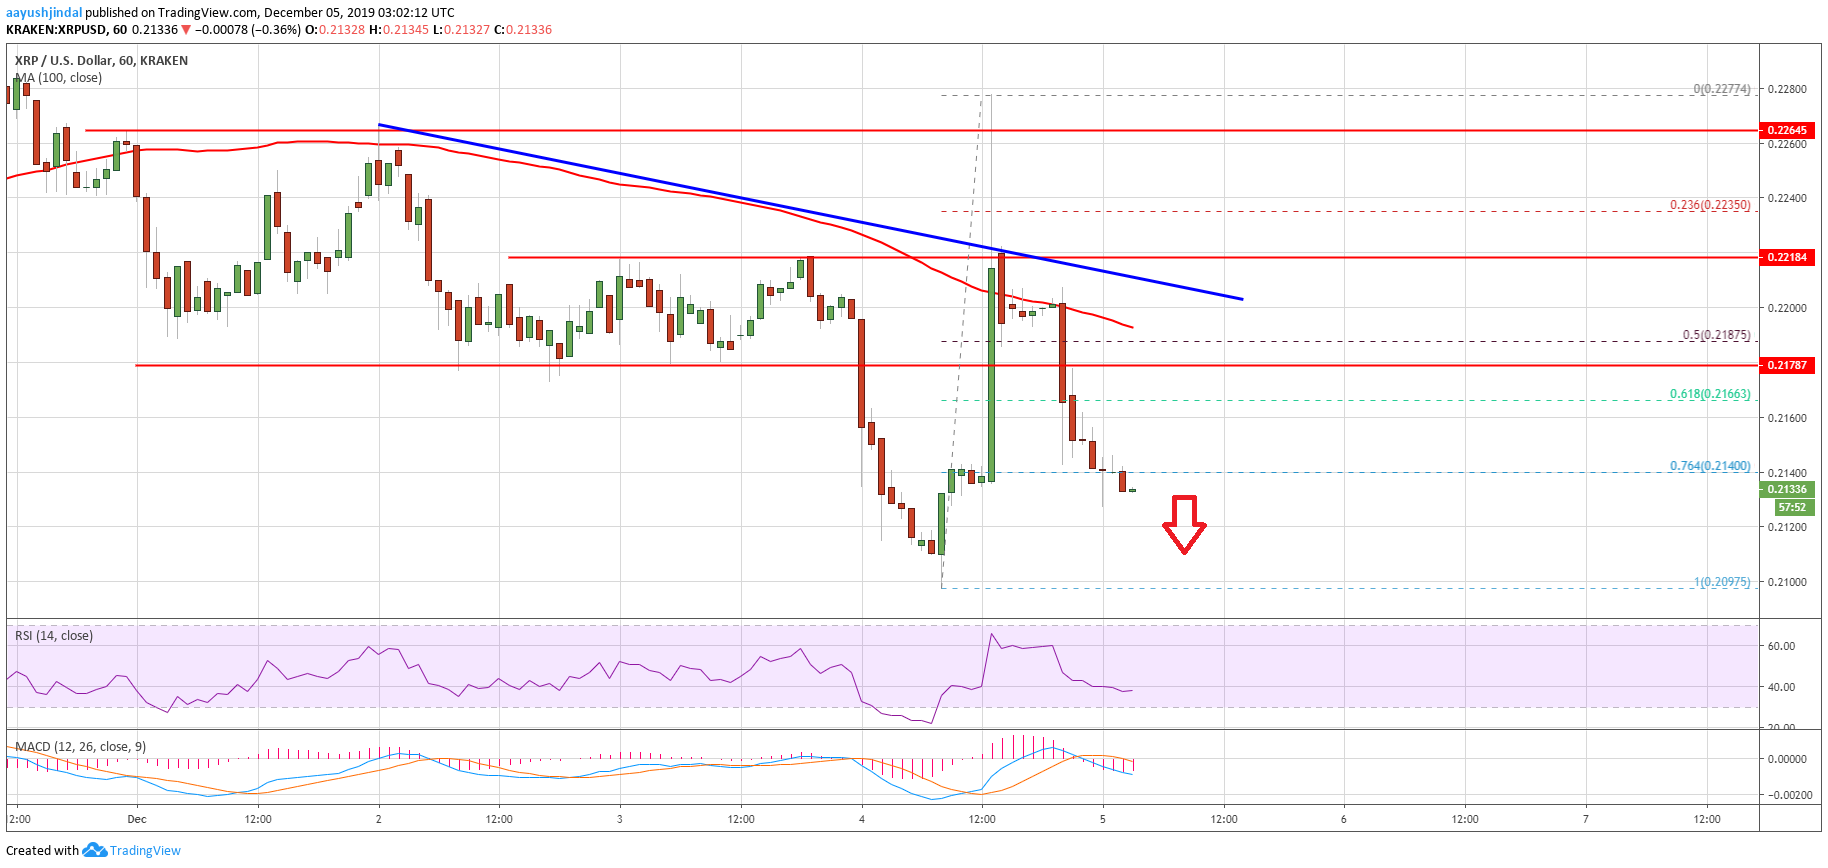
Looking at the chart, ripple price is down and out below $0.2180. Thus, there are high possibilities of a downside extension below the $0.2100 and $0.2050 levels in the coming sessions. The bears seem to be aiming the $0.2000 support.
Technical Indicators
Hourly MACD – The MACD for XRP/USD is currently gaining pace in the bearish zone.
Hourly RSI (Relative Strength Index) – The RSI for XRP/USD is declining and it is well below the 50 level.
Major Support Levels – $0.2100, $0.2050 and $0.2000.
Major Resistance Levels – $0.2180, $0.2200 and $0.2210.