

- Ripple price is sliding and it is under pressure below the $0.2200 resistance against the US dollar.
- The price is now trading below $0.2150 and it could decline further below $0.2100.
- There is a crucial bearish trend line forming with resistance near $0.2180 on the hourly chart of the XRP/USD pair (data source from Kraken).
- There are high chances of a drop towards the $0.2020 and $0.2000 support levels.
Ripple price is declining steadily below key supports against the US Dollar and bitcoin. XRP price could continue to move down and the bears might target $0.2000.
Ripple Price Analysis
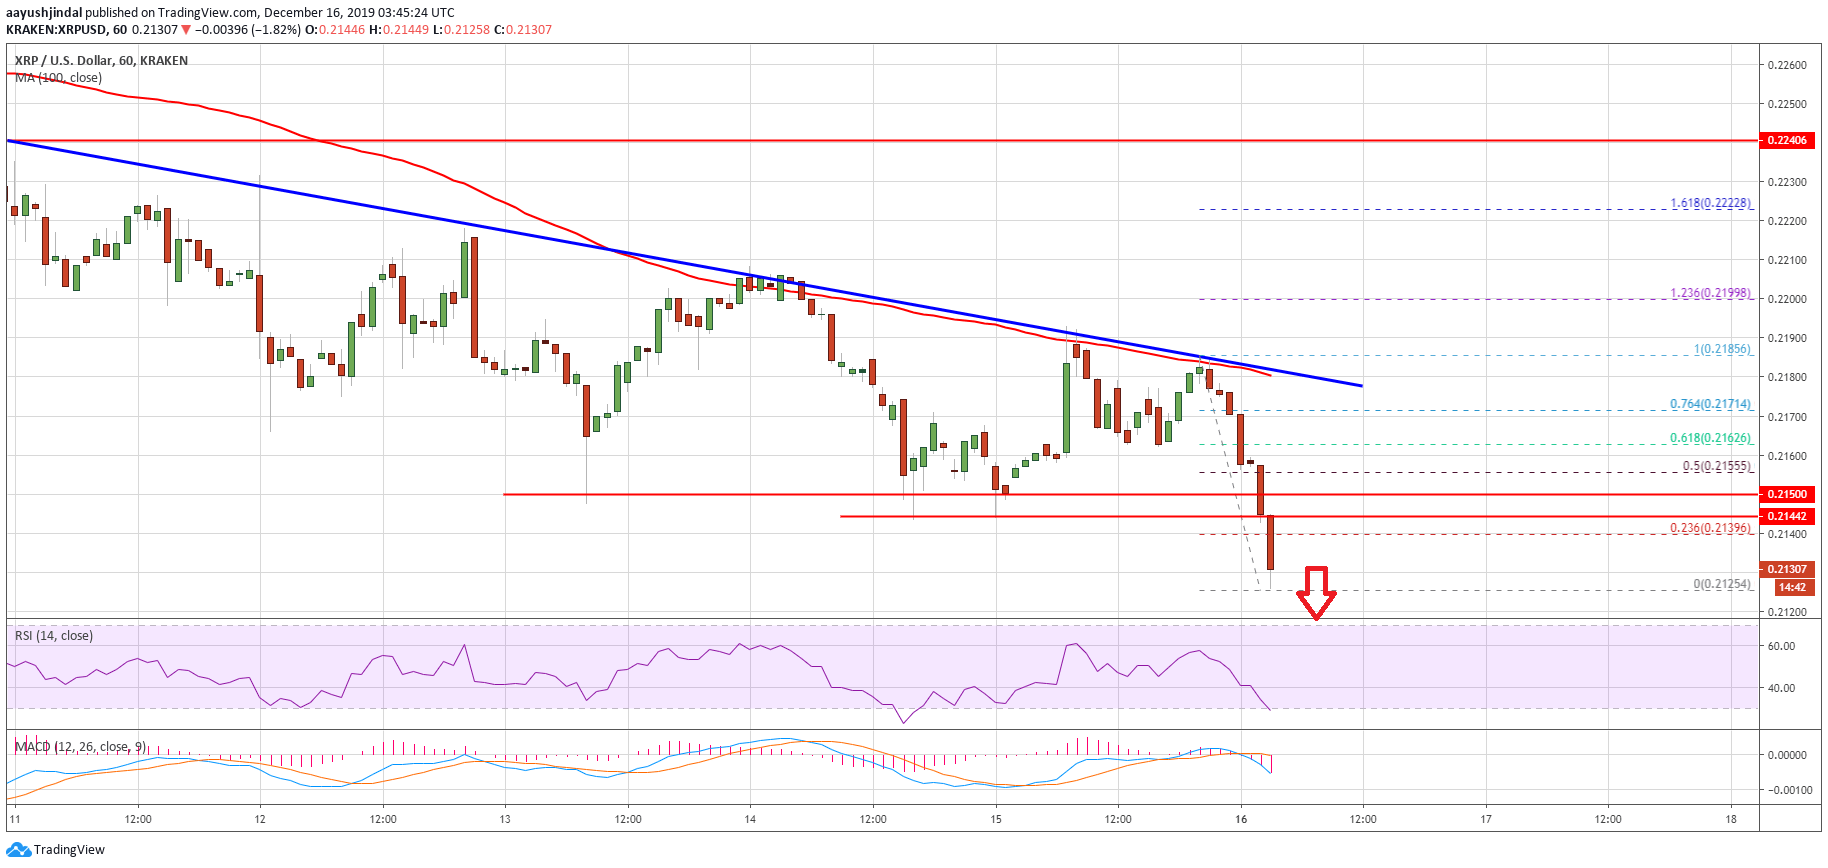
Recently, there were range moves below the $0.2200 and $0.2200 resistances in ripple against the US Dollar. Moreover, XRP price remained well below the $0.2240 resistance and the 100 hourly simple moving average.
As a result, there was another bearish wave and the price broke the $0.2150 support level. The decline was such that the price even declined below the $0.2140 support.
A new monthly low is formed near the $0.2125 level and the price is still following a downtrend. An immediate resistance is near the $0.2140 level. Besides, it is near the 23.6% Fib retracement level of the recent decline from the $0.2185 high to $0.2125 low.
On the upside, the first major resistance is near the $0.2150 area (the recent breakdown support). Additionally, the 50% Fib retracement level of the recent decline from the $0.2185 high to $0.2125 low is also near the $0.2140 level.
The next major resistance area is near the $0.2180 level. More importantly, there is a crucial bearish trend line forming with resistance near $0.2180 on the hourly chart of the XRP/USD pair.
Therefore, ripple price needs to clear the $0.2150 and $0.2180 resistance levels to start a decent recovery. Still, there are other hurdles on the upside near the $0.2200 and $0.2220 levels.
On the downside, an initial support is near the $0.2110 and $0.2100 levels. If the price fails to stay above the $0.2100 support, there are chances of a sharp decline towards the $0.2000 support area. An intermediate support could be near the $0.2040 level.
Looking at the chart, ripple price is clearly declining heavily and it seems like the bears are targeting further losses below $0.2100. If they remain in action, the price is likely to test the main $0.2000 support area in the near term.
Technical Indicators
Hourly MACD – The MACD for XRP/USD is currently gaining strength in the bearish zone.
Hourly RSI (Relative Strength Index) – The RSI for XRP/USD is currently sliding and moving into the oversold area.
Major Support Levels – $0.2110, $0.2100 and $0.2000.
Major Resistance Levels – $0.2150, $0.2180 and $0.2200.