

- Ripple price is slowly recovering, but struggling to gain momentum above $0.2800 against the US dollar.
- The price is facing a lot of hurdles on the upside near the $0.2820 and $0.2840 levels.
- There is a key bearish trend line forming resistance near $0.2840 on the hourly chart of the XRP/USD pair (data source from Kraken).
- Both Ethereum and bitcoin are recovering above $188 and $9,000 respectively.
Ripple price is struggling to correct higher against the US Dollar and bitcoin. XRP price is likely to decline again if it fails to surpass $0.2840 and $0.2850.
Ripple Price Analysis
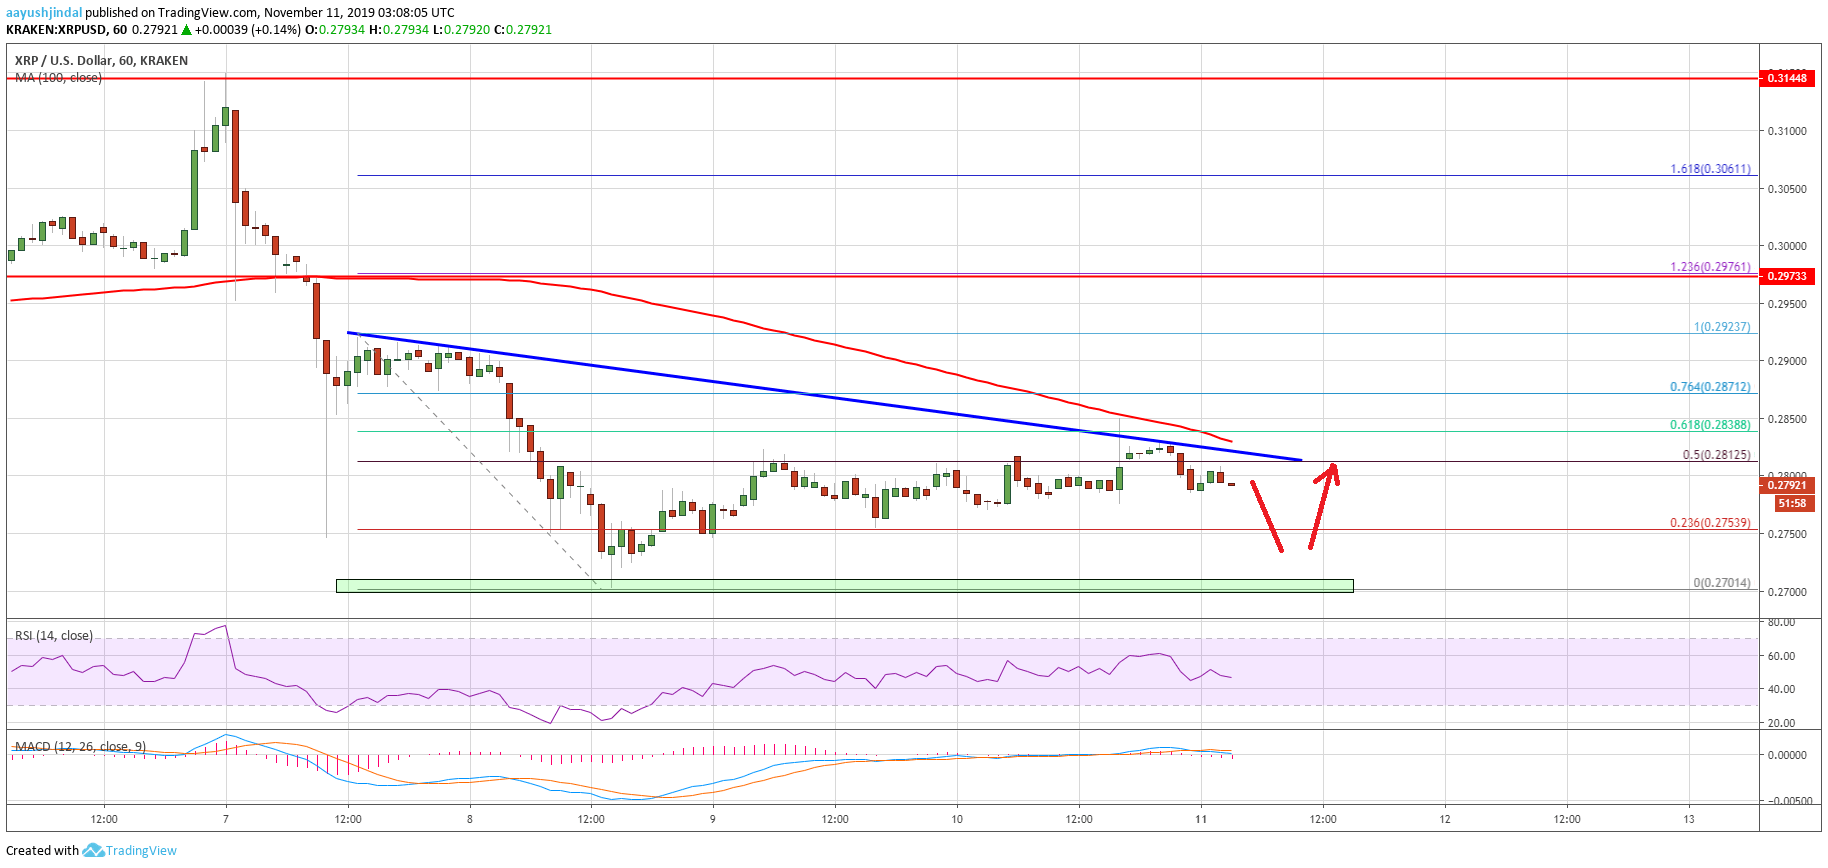
This past week, there was a sharp decline in ripple below the $0.3000 support area against the US Dollar. XRP/USD declined heavily and broke many supports near the $0.2950 and $0.2850 levels.
Moreover, there was a close below the $0.2850 level and the 100 hourly simple moving average. As a result, there was a break below $0.2800 and the price traded as low as $0.2701.
Later, there was an upside correction above the $0.2750 resistance level. Besides, the price traded above the 23.6% Fib retracement level of the downward move from the $0.2923 high to $0.2701 low.
Ripple even recovered above the $0.2800 level, but it is facing a strong resistance near the $0.2840 and $0.2850 levels. Additionally, the 50% Fib retracement level of the downward move from the $0.2923 high to $0.2701 low is acting as a resistance.
More importantly, there is a key bearish trend line forming resistance near $0.2840 on the hourly chart of the XRP/USD pair. The 100 hourly SMA is also positioned near the trend line and the $0.2850 resistance.
Therefore, ripple price must surpass the $0.2850 resistance and the 100 hourly SMA to start a decent recovery in the near term. The next key resistance is near the $0.2900 and $0.2910 levels.
On the downside, an immediate support is near the $0.2750 level. If there is a bearish break below the $0.2750 support, the price could revisit the $0.2700 support area. Any further losses may perhaps push the price towards the $0.2650 support area.
Looking at the chart, ripple price is clearly facing a lot of important hurdles near the $0.2840 and $0.2850 levels. A clear break above the $0.2850 resistance might start a recovery towards the $0.3000 resistance area. If not, there is a risk of more losses below the $0.2750 and $0.2700 support levels.
Technical Indicators
Hourly MACD – The MACD for XRP/USD is still moving in the bearish zone.
Hourly RSI (Relative Strength Index) – The RSI for XRP/USD is currently under pressure below the 50 level.
Major Support Levels – $0.2750, $0.2700 and $0.2650.
Major Resistance Levels – $0.2840, $0.2850 and $0.2910.