

- Ripple price corrected lower, but the $0.4200 area acted as a strong support against the US dollar.
- The price bounced back above the $0.4340 and $0.4400 levels to move back in a positive zone.
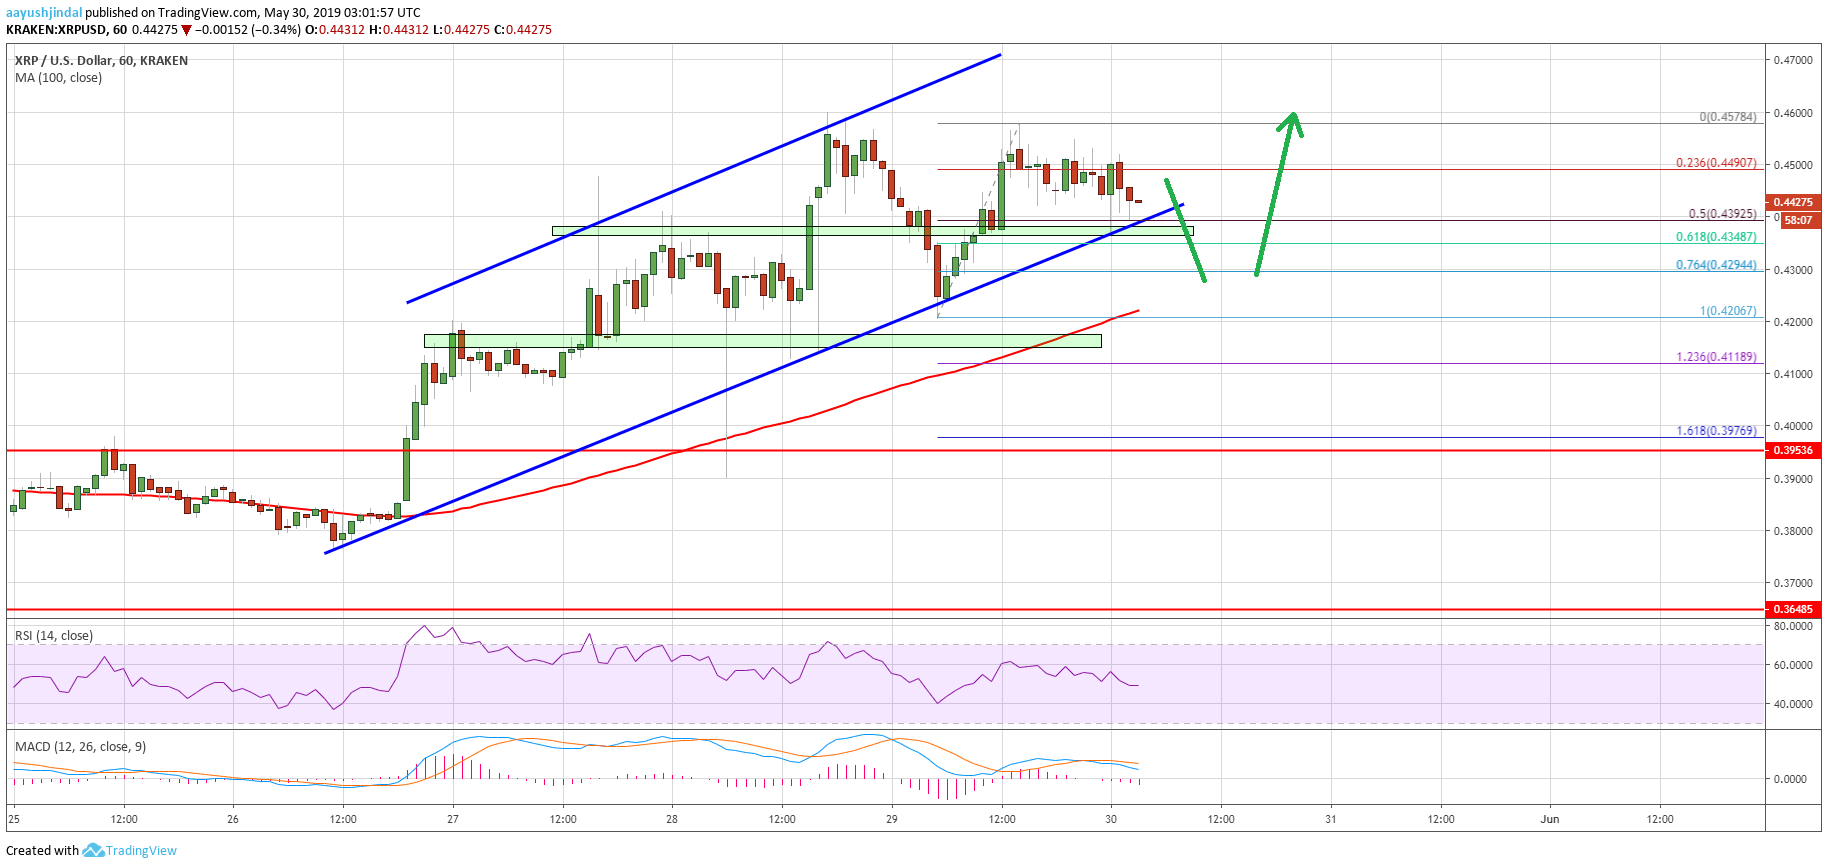
- Yesterday’s highlighted crucial ascending channel is intact with support at $0.4380 on the hourly chart of the XRP/USD pair (data source from Kraken).
- The pair is likely to correct lower once again before a fresh increase above the $0.4600 resistance area.
Ripple price is gaining bullish momentum against the US Dollar and bitcoin. XRP might dip sharply to fill buy orders before it climbs back above the $0.4600 and $0.4650 levels.
Ripple Price Analysis
This week, there was a strong and steady rise in ripple price from the $0.3950 support against the US Dollar. The XRP/USD pair traded higher and surpassed many barriers near $0.4200 and $0.4400. There was a proper close above the $0.4200 level and the 100 hourly simple moving average. The price rallied towards the $0.4600 level, but struggled to continue higher. As a result, there was a sharp downside correction below the $0.4500 and $0.4450 support levels.
A swing low was formed at $0.4206 before the price climbed higher. More importantly, yesterday’s highlighted crucial ascending channel is intact with support at $0.4380 on the hourly chart of the XRP/USD pair. The pair traded as high as $0.4578 and it is currently correcting lower. It broke the $0.4500 level and the 23.6% Fib retracement level of the recent wave from the $0.4206 low to $0.4578 high. However, the $0.4400 support area is acting as a support. Moreover, the 50% Fib retracement level of the recent wave from the $0.4206 low to $0.4578 high is holding losses.
Still, there are chances of a downside break below the $0.4400 and $0.4380 supports. In the mentioned case, the price could spike towards the $0.4300 or $0.4250 support levels. The main support is near the $0.4200 level and the 100 hourly simple moving average. As long as the price is above the $0.4200 support, it remains in an uptrend.
Looking at the chart, ripple price is currently trading above a few important supports such as $0.4380. The bulls remain in control, but there could be another dip below $0.4380 before the price starts a fresh increase. On the upside, an initial resistance is near the $0.4500 level, above which the price is likely to grind above the $0.4600 level.
Technical Indicators
Hourly MACD – The MACD for XRP/USD is slowly moving in the bearish zone.
Hourly RSI (Relative Strength Index) – The RSI for XRP/USD is currently above the 50 level, with a positive angle.
Major Support Levels – $0.4400, $0.4380 and $0.4200.
Major Resistance Levels – $0.4500, $0.4520 and $0.4600.