

- Ripple price started a downside correction after setting a new monthly high at $0.2993 against the US dollar.
- The price declined below the $0.2920 support area and tested the $0.2840 support area.
- Yesterday’s highlighted major bullish trend line with support near $0.2860 is intact on the hourly chart of the XRP/USD pair (data source from Kraken).
- The price remains supported near the $0.2860 and $0.2820 levels in the near term.
Ripple price is holding an important support area against the US Dollar and bitcoin. XRP price must stay above $0.2800 to bounce back in the near term.
Ripple Price Analysis
Yesterday, we saw a solid rise in ripple price above $0.2920 resistance against the US Dollar, while bitcoin remained in a bearish zone. XRP price even gained strength above the $0.2950 resistance 100 hourly simple moving average. It traded towards the $0.3000 resistance area and formed a new monthly high near the $0.2993 level. Later, there was a downside correction below the $0.2950 level.
Moreover, the price broke the $0.2920 support area. It even spiked below the $0.2850 and $0.2840 support levels. However, it stayed above the $0.2800 pivot level. A low was formed near $0.2828 and the price is currently rebounding. There was a break above the 23.6% Fib retracement level of the recent decline from the $0.2993 high to $0.2828 low.
However, the $0.2920 area is once again acting as a resistance. It also coincides with the 50% Fib retracement level of the recent decline from the $0.2993 high to $0.2828 low. Besides, there is a connecting bearish trend line forming with resistance near $0.2910 on the hourly chart of the XRP/USD pair. Therefore, ripple must gain strength above $0.2910 and $0.2920 to resume its upward move.
On the downside, an immediate support is near the $0.2850 level. More importantly, yesterday’s highlighted major bullish trend line with support near $0.2860 is intact on the hourly chart of the XRP/USD pair. The main support is near the $0.2800 level and the 100 hourly simple moving average. If there is a downside break below the $0.2800 support area, the price could start a fresh decline.
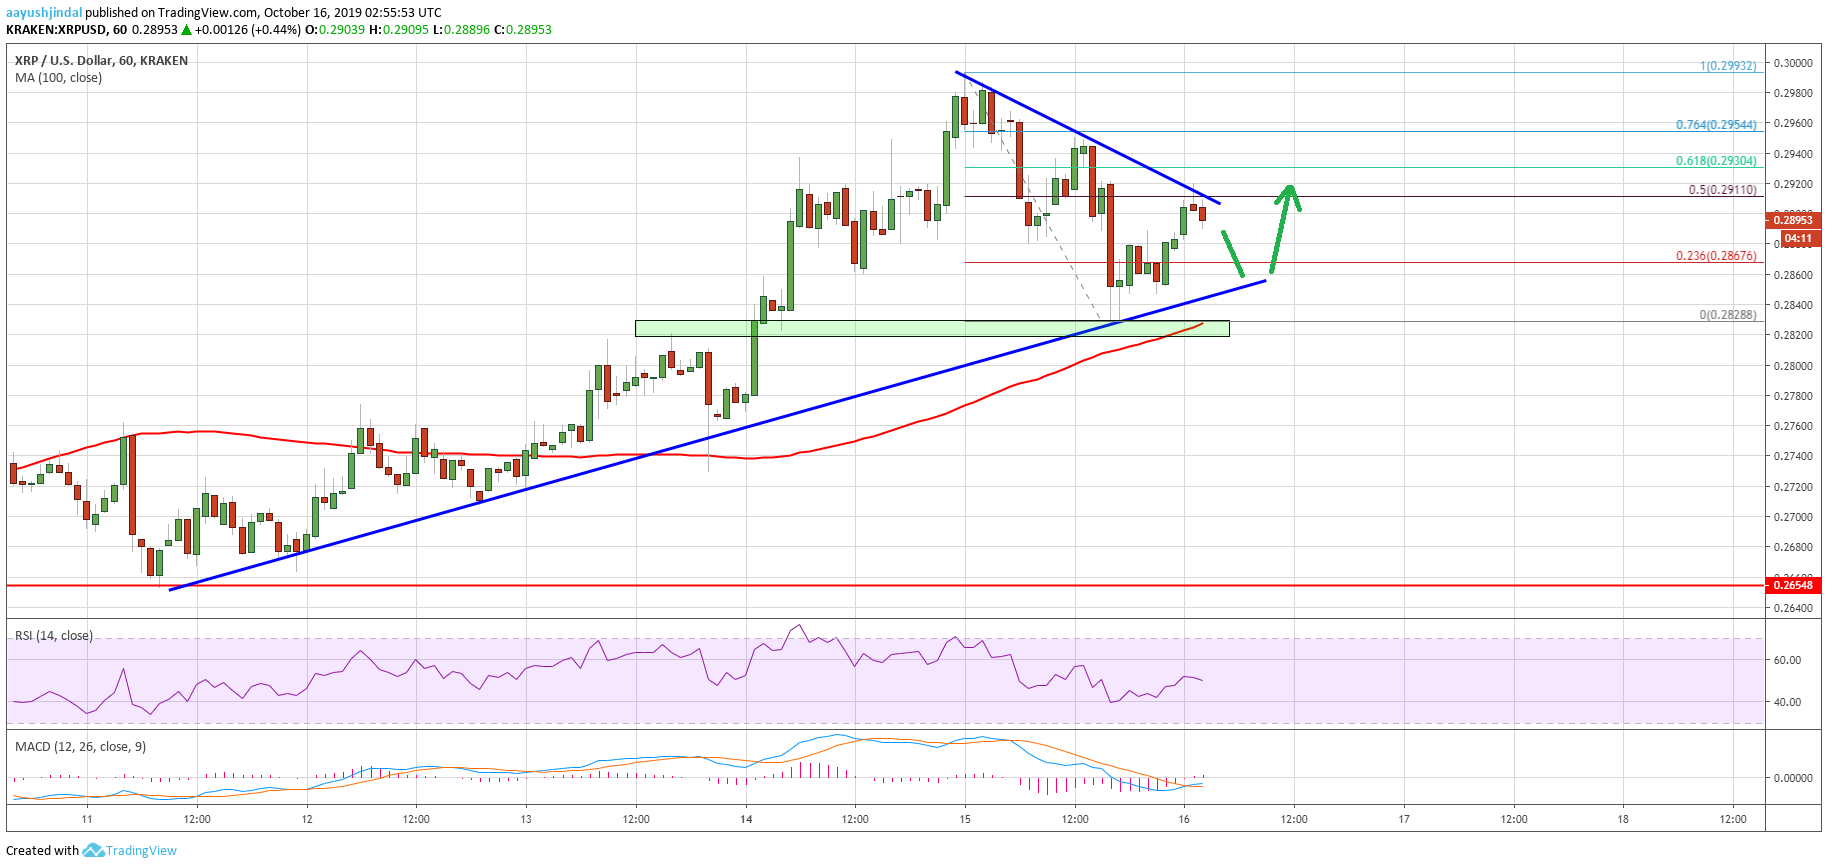
Looking at the chart, ripple price is clearly holding an important support near the $0.2800 and $0.2840 levels. As long as there is no close below the $0.2800 pivot level, the price could bounce back. On the upside, a close above $0.2920 is needed for more upsides.
Technical Indicators
Hourly MACD – The MACD for XRP/USD is slowly moving in the bullish zone.
Hourly RSI (Relative Strength Index) – The RSI for XRP/USD is struggling to stay above the 50 level.
Major Support Levels – $0.2850, $0.2820 and $0.2800.
Major Resistance Levels – $0.2920, $0.2950 and $0.3000.