
- Ripple price is showing a lot of positive signs above the $0.2120 support against the US dollar.
- The price is likely to break the $0.2240 and $0.2270 resistance levels to continue higher.
- Yesterday’s key bearish trend line was breached with resistance near $0.2175 on the hourly chart of the XRP/USD pair (data source from Kraken).
- The price remains supported for more gains unless it drops back below the $0.2120 support area.
Ripple price is likely to accelerate higher against the US Dollar and bitcoin. The main resistance for XRP is near $0.2350, above which it could turn bullish.
Ripple Price Analysis
Yesterday, we saw a decent recovery in ripple from the $0.2000 support area against the US Dollar. XRP price rallied above the $0.2080 and $0.2120 resistance levels.
Moreover, there was a break above the $0.2200 resistance area. However, the price struggled to clear the $0.2240 and $0.2250 resistance levels. A high was formed near $0.2245 and the price corrected gains.
On the downside, the $0.2150 level acted as a strong support. The last swing low was near $0.2153 and the price climbed higher again. During the rise, yesterday’s key bearish trend line was breached with resistance near $0.2175 on the hourly chart of the XRP/USD pair.
It is now trading near the $0.2240 resistance and the 100 hourly simple moving average. An initial support is near the $0.2195 level. It coincides with the 50% Fib retracement level of the recent wave from the $0.2195 low to $0.2238 high.
The first key support on the downside is near the $0.2175 level. It is also close to the 76.4% Fib retracement level of the recent wave from the $0.2195 low to $0.2238 high. The main supports are $0.2150 and $0.2120.
If there is a downside break below $0.2120, ripple is likely to move back into a bearish zone. The next key support is seen near the $0.2020 and $0.2000 levels.
Conversely, the price could surge above the $0.2250 resistance area. The next key resistance is near the $0.2270 level, above which the price could accelerate gains towards the $0.2350 resistance area.
To move into an uptrend, the price must settle above the $0.2350 resistance area. If not, it is likely to resume its downtrend below the $0.2120 support area.
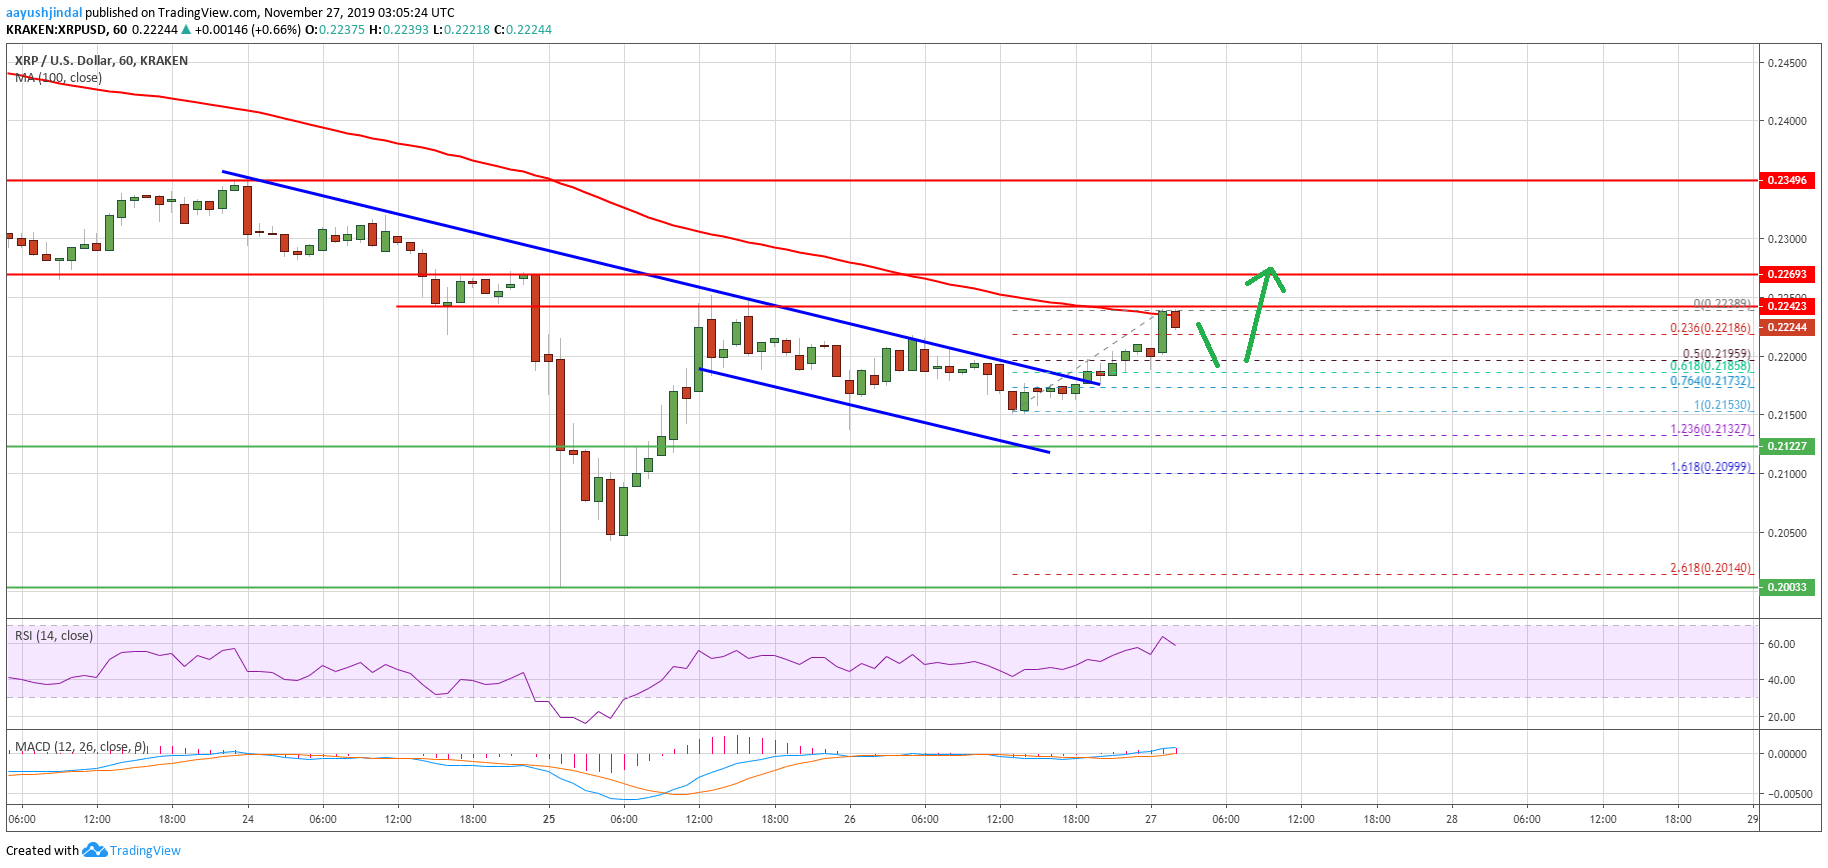
Looking at the chart, ripple price is showing a few positive signs above the $0.2150 support. The current price action suggests high chances of a rally above the $0.2250 resistance.
Technical Indicators
Hourly MACD – The MACD for XRP/USD is gaining pace in the bearish zone.
Hourly RSI (Relative Strength Index) – The RSI for XRP/USD is currently correcting lower towards the 55 level.
Major Support Levels – $0.2170, $0.2150 and $0.2120.
Major Resistance Levels – $0.2250, $0.2270 and $0.2350.