

- Ripple price declined heavily after it broke the key $0.2850 support area against the US dollar.
- The price tested the main $0.2500 support area and it is currently rebounding above $0.2650.
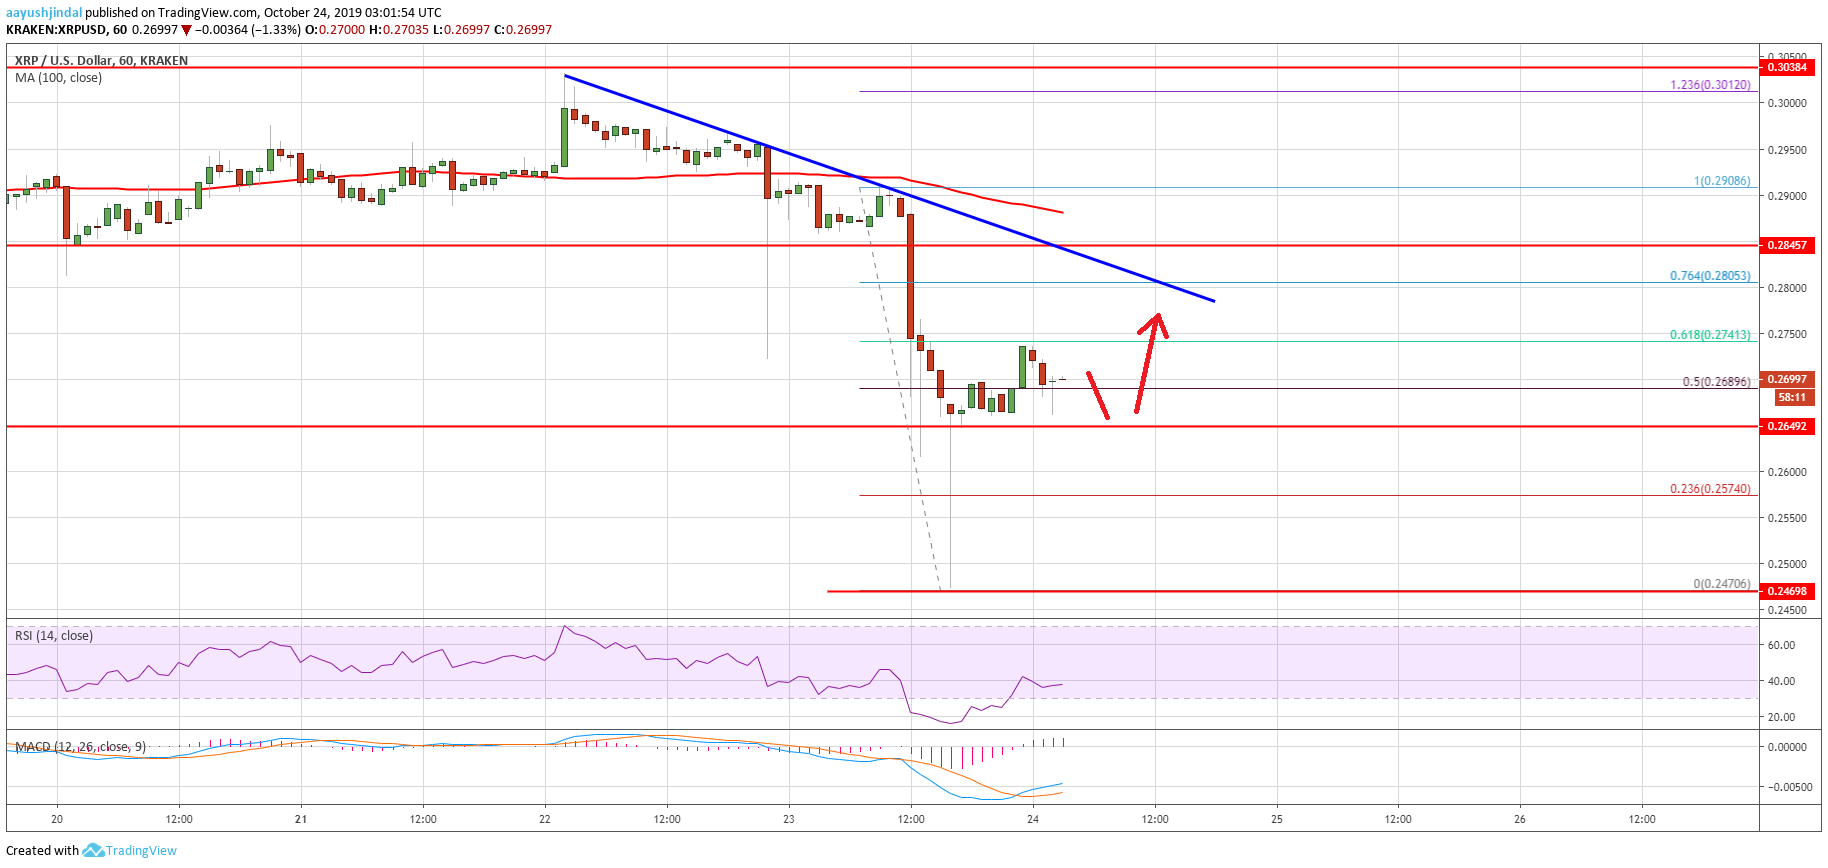
- There is a major bearish trend line forming with resistance near $0.2800 on the hourly chart of the XRP/USD pair (data source from Kraken).
- There is showing signs of a strong recovery and it might rebound towards the $0.2850 resistance.
Ripple price is correcting losses against the US Dollar and bitcoin. Recently, XRP price dived close to 10%, but the $0.2500 area acted as a strong support.
Ripple Price Analysis
Yesterday, we saw a minor downside correction in ripple from the $0.3000 resistance against the US Dollar. However, XRP price failed to hold the key $0.2850 support area and declined heavily in the last three sessions.
During the slide, there was a break below a few important supports near $0.2800 and $0.2720. Moreover, the price settled below $0.2800 and 100 hourly simple moving average. It opened the doors for more downsides below the $0.2650 support.
Finally, the price spiked below the $0.2550 and $0.2500 support levels. The price action suggests that the $0.2500 area acted as a strong support. As a result, ripple recovered aggressively and climbed back above the $0.2600 level.
Additionally, there was a break above the 50% Fib retracement level of the recent decline from the $0.2908 high to $0.2470 low. An immediate resistance on the upside is near the $0.2720 and $0.2750 levels.
The main hurdle is near the $0.2750 level since it coincides with the 61.8% Fib retracement level of the recent decline from the $0.2908 high to $0.2470 low. More importantly, there is a major bearish trend line forming with resistance near $0.2800 on the hourly chart of the XRP/USD pair.
On the downside, the $0.2650 area is a strong support for the current wave. As long as ripple is trading above the $0.2650 support, it could recover towards the $0.2800 and $0.2850 resistance levels.
Conversely, if the price fails to correct above $0.2750 and $0.2800, there is a risk of another slide below the $0.2650 support. The next support is near the $0.2570 and $0.2550 levels.
Looking at the chart, ripple price clearly retreating after testing the main $0.2500 support area. There are positive signs visible on the chart, but the bulls could find it difficult to push the price back above $0.2750 and $0.2800.
Technical Indicators
Hourly MACD – The MACD for XRP/USD is currently moving nicely in the bullish zone.
Hourly RSI (Relative Strength Index) – The RSI for XRP/USD is correcting higher and is currently near the 40 level.
Major Support Levels – $0.2650, $0.2550 and $0.2500.
Major Resistance Levels – $0.2750, $0.2800 and $0.2850.