

- Ripple price traded to a new weekly low at $0.2918 and recently recovered against the US dollar.
- The price climbed higher and broke the $0.2985 and $0.3000 resistance levels.
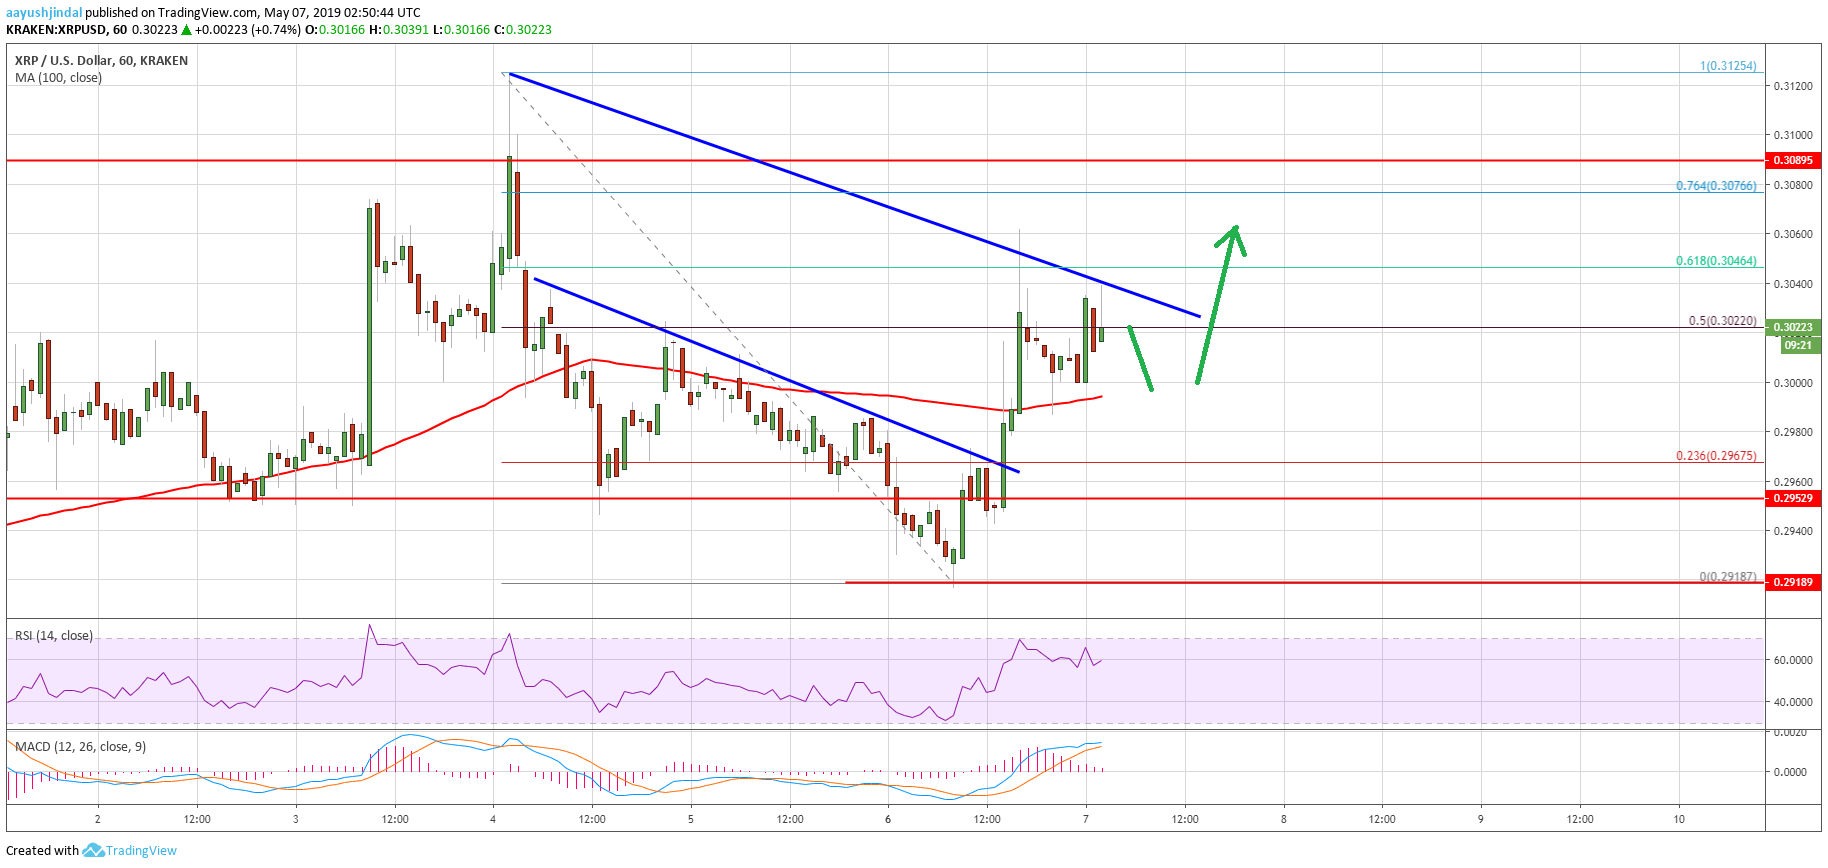
- There was a break above a key bearish trend line with resistance near $0.2970 on the hourly chart of the XRP/USD pair (data source from Kraken).
- The pair is currently facing a strong resistance near the $0.3040 and $0.3050 levels.
Ripple price started a decent recovery against the US Dollar after a strong upward move in bitcoin and Ethereum. XRP broke the $0.3000 level and it may move higher towards $0.3100.
Ripple Price Analysis
Yesterday, we saw an increase in bearish pressure ripple price below $0.3020 against the US Dollar. The XRP/USD pair traded below the key $0.3000 support level and even settled below the 100 hourly simple moving average. It opened the doors for more losses and the price even broke the $0.2950 support level. A new weekly low was formed near $0.2918 and recently the price bounced back. The main driving force was bitcoin, trading above the $5,850 resistance level.
During the recent rise, there was a break above a key bearish trend line with resistance near $0.2970 on the hourly chart of the XRP/USD pair. There was a clear break above the 50% Fib retracement level of the downside move from the $0.3125 high to $0.2918 low. Besides, the pair broke the $0.3000 resistance and the 100 hourly simple moving average. However, the price faced a strong resistance near the $0.3040 and $0.3050 levels. It seems like the price struggled to clear the 61.8% Fib retracement level of the downside move from the $0.3125 high to $0.2918 low.
There is also a connecting bearish trend line in place with resistance near $0.3040 on the same chart. Therefore, a clear break above the $0.3040 and $0.3050 resistance levels may open the doors for more gains. The next key resistance is near the $0.3080 and $0.3100 levels. Above $0.3100, the price may attempt to clear the last swing high near the $0.3125 level.

Looking at the chart, ripple price clearly recovered nicely after trading to a new weekly low and $0.3000. The current price action is positive above $0.3000. If there is a downside correction, the price may find bids near the $0.3000 level and the 100 hourly SMA. Any further declines may push the price back in a bearish zone towards $0.2920.
Technical Indicators
Hourly MACD – The MACD for XRP/USD is showing negative signs in the bullish zone.
Hourly RSI (Relative Strength Index) – The RSI for XRP/USD is currently retreating from the 60 level.
Major Support Levels – $0.3010, $0.3000 and $0.2950.
Major Resistance Levels – $0.3040, $0.3080 and $0.3100.