
- Ripple price corrected lower recently and tested the $0.3175 level against the US dollar.
- The price bounced back and traded above the $0.3200 and $0.3220 resistance levels.
- There was a break above a key bearish trend line with resistance near $0.3220 on the hourly chart of the XRP/USD pair (data source from Kraken).
- The pair is currently forming a bullish continuation pattern and it could revisit the $0.3300 resistance.
Ripple price is slowly recovering against the US Dollar, whereas still struggling versus bitcoin. XRP could recover further above $0.3280, but it is likely to struggle near $0.3320.
Ripple Price Analysis
Recently, we saw a strong downside correction in ripple price from the $0.3470 swing high against the US Dollar. The XRP/USD pair declined below the $0.3320 and $0.3250 support levels. The pair even broke the $0.3200 level and traded close to the $0.3175 level, where buyers took a stand. Finally, the price started a decent rebound and recovered above the $0.3200 level. There was a break above the 23.6% Fib retracement level of the last drop from the $0.3470 high to $0.3174 low.
Moreover, there was a break above a key bearish trend line with resistance near $0.3220 on the hourly chart of the XRP/USD pair. The pair spiked above the $0.3300 level, but it faced a strong resistance near the $0.3320 level. The 100 hourly simple moving average also acted as a strong resistance. Besides, the 50% Fib retracement level of the last drop from the $0.3470 high to $0.3174 low also acted as a hurdle for buyers. The price retreated from highs and retested the $0.3200 level.
At the outset, the price seems to be forming a bullish continuation pattern with resistance at $0.3260 on the same chart. A break above the $0.3260 level is likely to push the price above the $0.3280 resistance. The price might even break the $0.3300 level, but it is likely to struggle near the $0.3320 level. Above $0.3320, the price could face resistance near $0.3345 and $0.3360. On the flip side, if the price struggles to move above $0.3280 or $0.3300, there may be a fresh decrease.
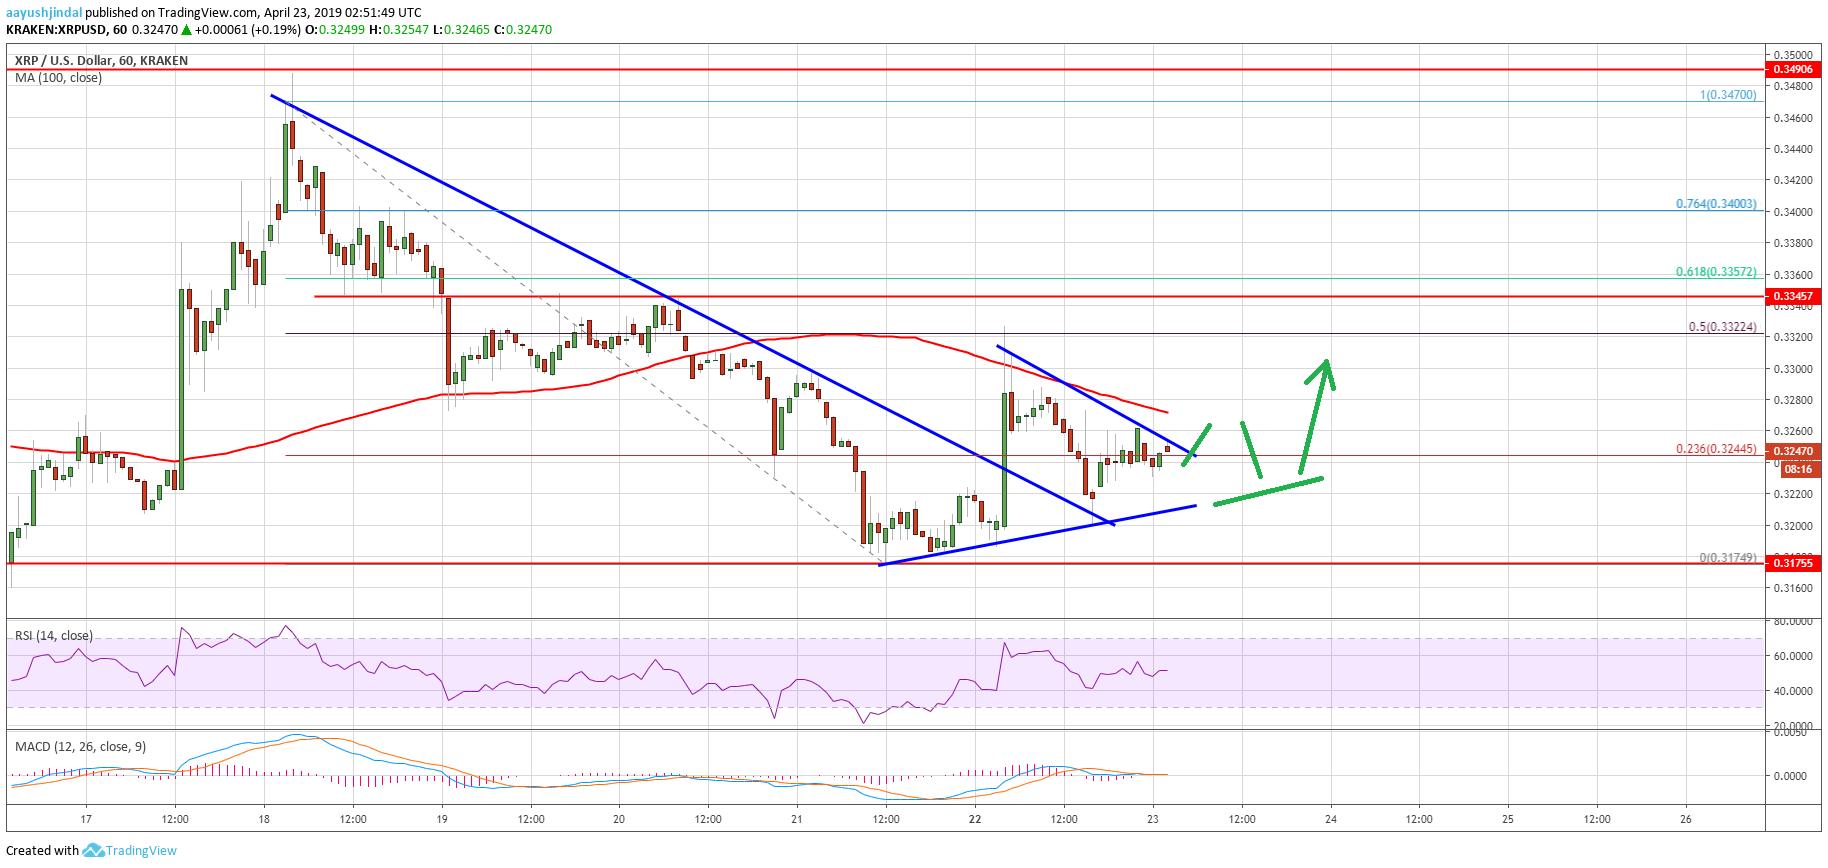

Looking at the chart, ripple price is clearly struggling below the $0.3300 and $0.3320 resistance levels. In the short term, there could be an upward move, but the price is likely to face a strong selling interest near $0.3300, $0.3320 and $0.3345. Only a successful close above $0.3360 might push the price towards $0.3500.
Technical Indicators
Hourly MACD – The MACD for XRP/USD is about to move into the bullish zone.
Hourly RSI (Relative Strength Index) – The RSI for XRP/USD is now placed nicely above the 50 level.
Major Support Levels – $0.3220, $0.3200 and $0.3175.
Major Resistance Levels – $0.3280, $0.3300 and $0.3320.