
Reason to trust
How Our News is Made
Strict editorial policy that focuses on accuracy, relevance, and impartiality
Ad discliamer
Morbi pretium leo et nisl aliquam mollis. Quisque arcu lorem, ultricies quis pellentesque nec, ullamcorper eu odio.
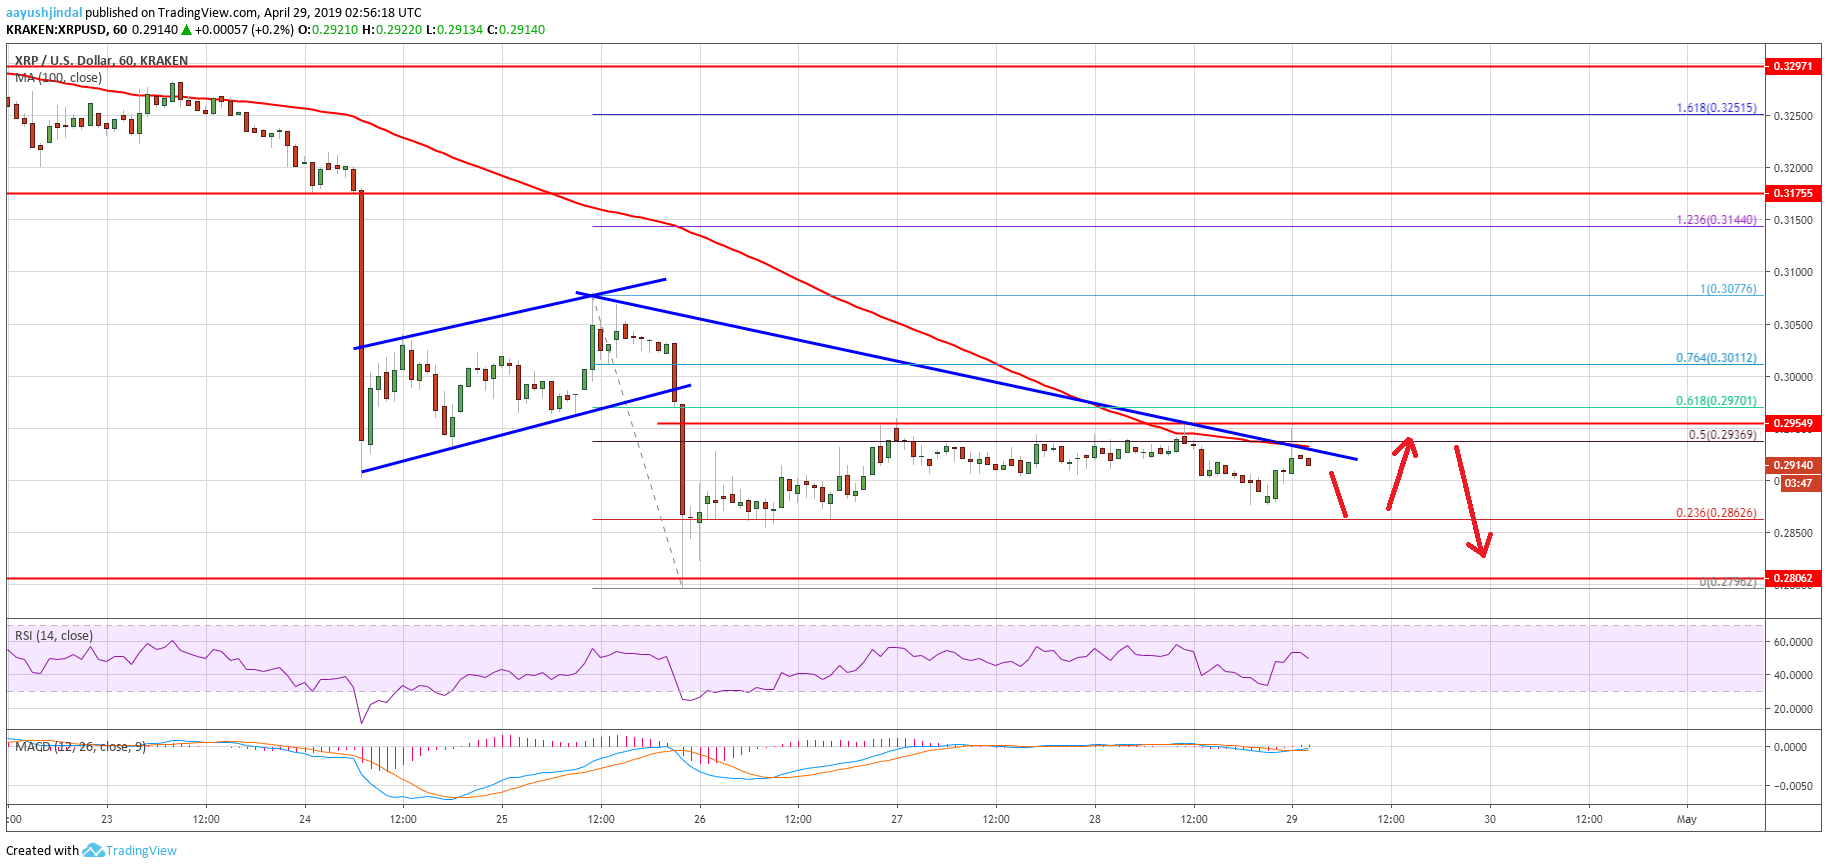
- Ripple price recovered recently above the $0.2900 level and tested $0.2960 against the US dollar.
- The price seems to be facing a strong resistance near the $0.2950 and $0.2960 resistance levels.
- There is a connecting bearish trend line forming with resistance near $0.2935 on the hourly chart of the XRP/USD pair (data source from Kraken).
- The pair could revisit the $0.2810 level as long as it is trading below $0.2960 and $0.3000.
Ripple price is facing a lot of hurdles on the upside against the US Dollar and bitcoin. XRP remains at a risk of more declines unless it climbs back above the $0.3000 resistance area.
Ripple Price Analysis
After a short term correction, ripple price extended losses below the $0.2950 support against the US Dollar. The XRP/USD pair broke the $0.2920 support level and declined heavily below $0.2900. It traded close to the $0.2800 level and settled well below the 100 hourly simple moving average. A new monthly low was formed at $0.2796 and the price recently corrected higher. It broke the $0.2860 level and the 23.6% Fib retracement level of the last drop from the $0.3077 high to $0.2796 low.
The price even moved above the $0.2900 level, but it faced a strong resistance near the $0.2950 and $0.2960 resistance levels. More importantly, the price failed to clear the 100 hourly simple moving average, which is currently near $0.2938. Besides, the price failed near the 50% Fib retracement level of the last drop from the $0.3077 high to $0.2796 low. Finally, there is also a connecting bearish trend line forming with resistance near $0.2935 on the hourly chart of the XRP/USD pair.
Therefore, ripple must break the $0.2950 resistance, the trend line, and the 100 hourly SMA. A successful close above the $0.2950-0.2960 zone could push the price towards the next resistance at $0.3000. Once there is a daily close above $0.3000, the price may start a decent recovery in the near term. On the downside, an initial support is near the $0.2860 level. If the bulls struggle to keep the price above $0.2860, the price could revisit the $0.2810 and $0.2800 support levels.
Looking at the chart, ripple price is clearly trading in a tight range below key resistances near $0.2960 and $0.3000. The bulls need to gain traction above $0.3000 to push the price back in a positive zone. If not, there is a risk of a fresh decline towards the $0.2810 or $0.2750 level.
Technical Indicators
Hourly MACD – The MACD for XRP/USD is likely to remain in the bearish zone.
Hourly RSI (Relative Strength Index) – The RSI for XRP/USD recently jumped above the 50 level.
Major Support Levels – $0.2860, $0.2810 and $0.2800.
Major Resistance Levels – $0.2950, $0.2960 and $0.3000.


