

- Ripple price surged recently above the $0.3040 and $0.3120 resistances against the US dollar.
- The price is currently trimming gains and trading near the $0.3000 support area.
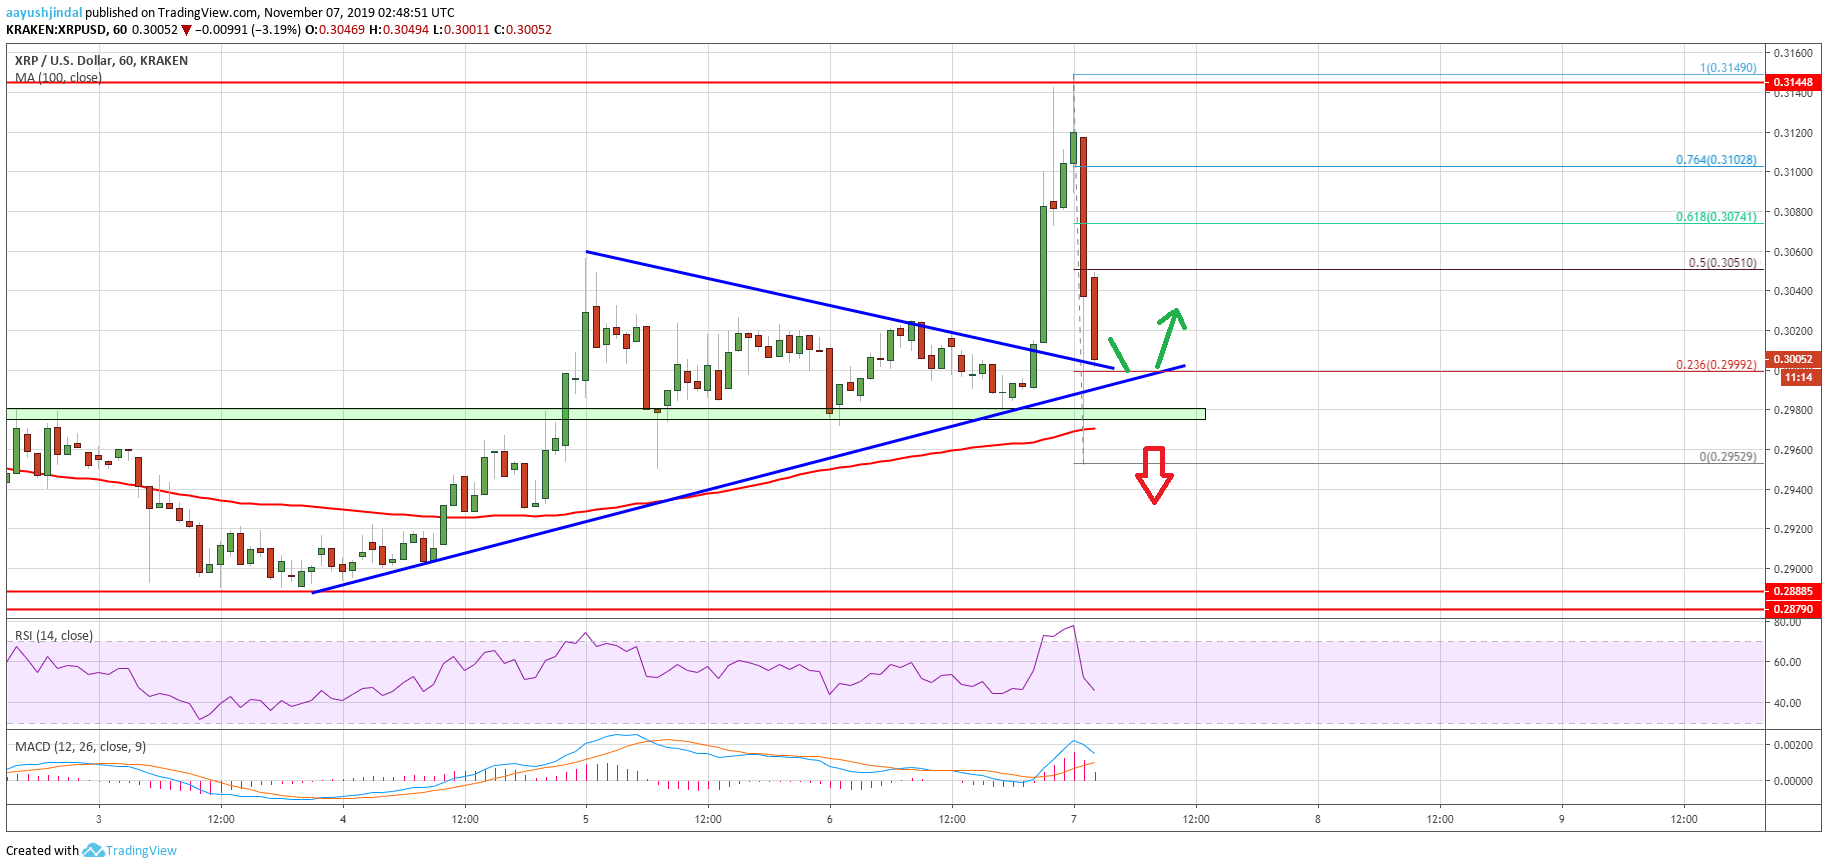
- Yesterday’s major bullish trend line is active with support near $0.2990 on the hourly chart of the XRP/USD pair (data source from Kraken).
- The main support is near the $0.2980 level, below which the price could accelerate losses.
Ripple price is swinging both ways against the US Dollar and bitcoin. XRP price must stay above the $0.2980 support area to start a fresh upward move.
Ripple Price Analysis
Yesterday, we saw bullish moves in ripple above the $0.2980 support area against the US Dollar. Recently, XRP rallied sharply above the $0.3040 and $0.3120 resistance levels.
However, the price faced a strong selling interest near the $0.3150 area. A new weekly high was formed near $0.3149 and the price is currently declining sharply. It tumbled below the $0.3040 and $0.3000 levels.
A swing low was formed near $0.2952 and the price is now back above $0.3000. Moreover, the price seems to be holding the key $0.2980 support area and the 100 hourly simple moving average.
An immediate resistance for ripple is near the $0.3050 area. It coincides with the 50% Fib retracement level of the recent decline from the $0.3149 high to $0.2952 low. If there are any further gains, the price could test the $0.3100 resistance area.
Besides, the 76.4% Fib retracement level of the recent decline from the $0.3149 high to $0.2952 low is also near the $0.3100 area to act as a resistance. A convincing break above $0.3100 could start a decent rise in the coming sessions.
On the downside, there are many important supports near the $0.3000 and $0.2980 levels. More importantly, yesterday’s major bullish trend line is active with support near $0.2990 on the hourly chart of the XRP/USD pair.
The main support is near the $0.2980 level and the 100 hourly SMA. If there is a close below the $0.2980 support, the price is likely to accelerate declines. The next key supports are near the $0.2900 and $0.2880 levels.
Looking at the chart, ripple price is swinging, but it is trading above the $0.2980 support area. As long as there is no close below $0.2980, it could bounce back above $0.3040 and $0.3050. Conversely, there is a risk of a fresh decline towards the $0.2880 support area.
Technical Indicators
Hourly MACD – The MACD for XRP/USD is about to move back into the bearish zone.
Hourly RSI (Relative Strength Index) – The RSI for XRP/USD is declining sharply below the 50 level.
Major Support Levels – $0.2990, $0.2980 and $0.2950.
Major Resistance Levels – $0.3040, $0.3050 and $0.3100.