

- Ripple price declined heavily after it broke the key $0.3500 support area against the US dollar.
- The price broke many supports on the way down such as $0.3440, $0.3350 and even $0.3250.
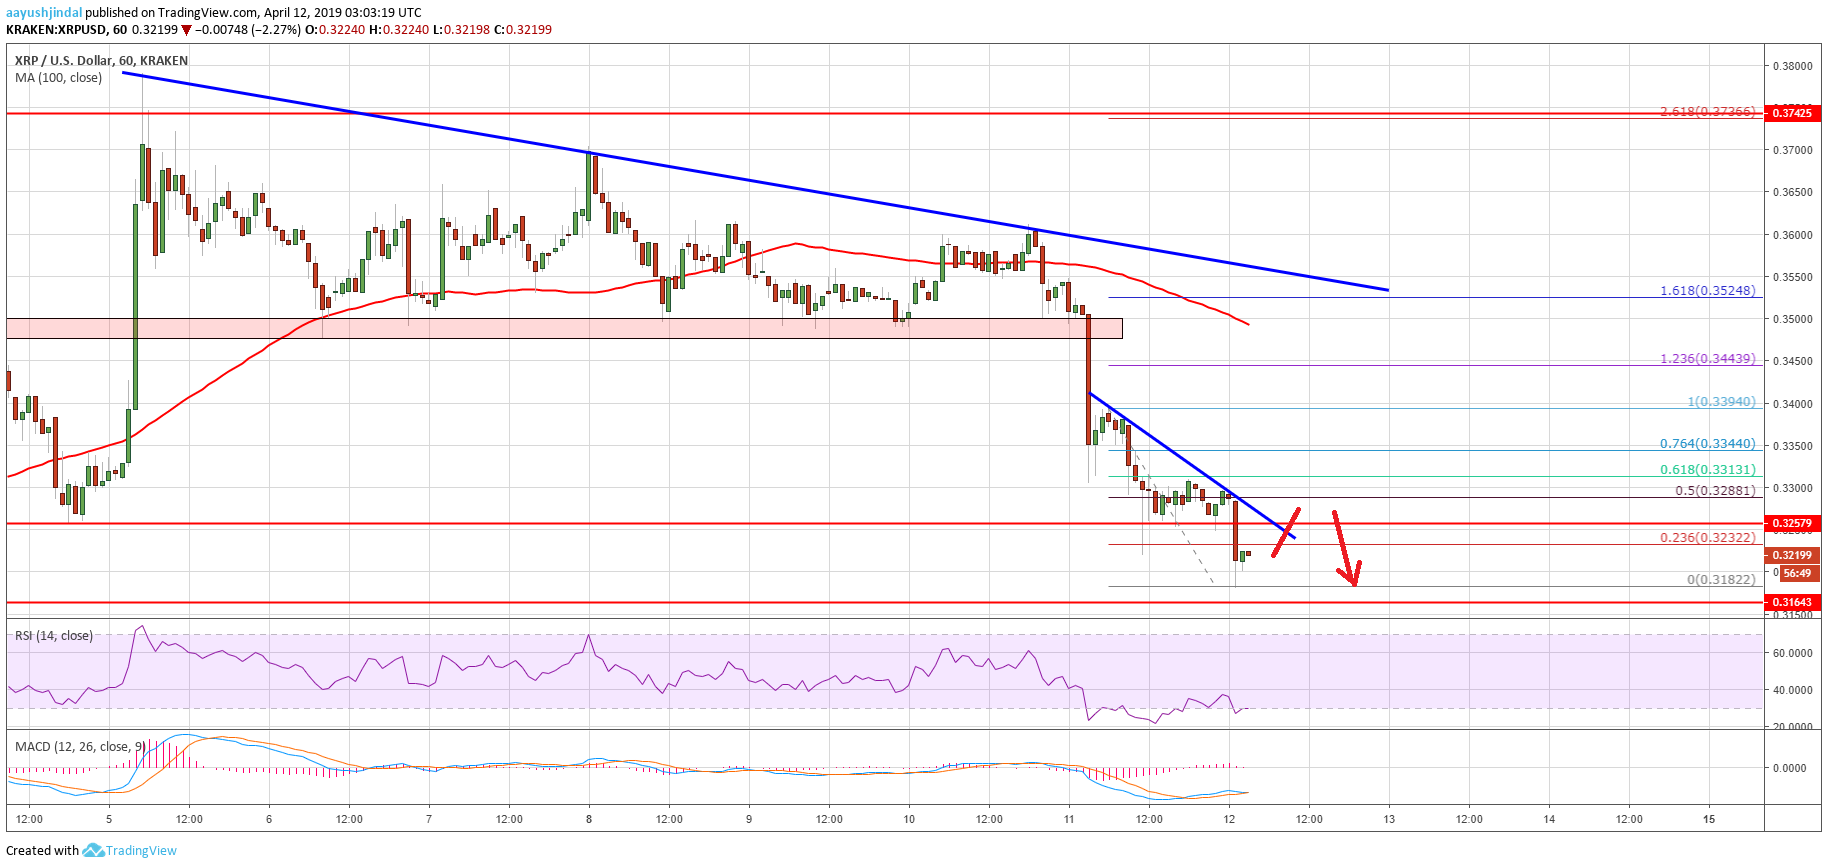
- There is a short term bearish trend line formed with resistance near $0.3260 on the hourly chart of the XRP/USD pair (data source from Kraken).
- The pair is clearly trading in a bearish zone and recovery could face sellers near $0.3260 or $0.3320.
Ripple price declined heavily below key supports against the US Dollar and bitcoin. XRP remains at a risk of more losses towards the $0.3150 or $0.3120 support level.
Ripple Price Analysis
After a continuous failure near the $0.3700 resistance, ripple price started a downside move against the US Dollar. The XRP/USD pair started a significant decline below the $0.3550 and $0.3480 support levels. There was even a close below the $0.3400 support and the 100 hourly simple moving average. Sellers gained control and pushed the price below the $0.3320 support level. The decline was such that the price even broke the key $0.3260-0.3250 support area.
A new weekly low was formed at $0.3182 and the price settled into a bearish zone. On the upside, an initial resistance is near the $0.3240 level and the 23.6% Fib retracement level of the recent decline from the $0.3394 high to $0.3182 low. There is also a short term bearish trend line formed with resistance near $0.3260 on the hourly chart of the XRP/USD pair. The $0.3260 level was a support earlier and now it could act as a strong resistance for buyers.
Above $0.3260, the next key resistance is near the $0.3310 level. The 61.8% Fib retracement level of the recent decline from the $0.3394 high to $0.3182 low is also near the same area. If there is a clear break above the $0.3320 level, the price could recover towards the $0.3440 level. On the other hand, if there is a downside break below $0.3180, there might be a test of the $0.3150 support or even $0.3120.

Looking at the chart, ripple price clearly trimmed most its gains and broke key supports near $0.3320 and $0.3260. These are bearish signs, suggesting more losses below $0.3180 in the short term. However, the price is likely to find a strong buying interest near the $0.3120 support arear in the coming sessions (if it continues to decline).
Technical Indicators
Hourly MACD – The MACD for XRP/USD is struggling to move into the bullish zone.
Hourly RSI (Relative Strength Index) – The RSI for XRP/USD declined heavily below 40 and it is currently near 28.
Major Support Levels – $0.3180, $0.3150 and $0.3120.
Major Resistance Levels – $0.3260, $0.3280 and $0.3320.