

- Ripple price is facing an increase in selling pressure below the $0.2980 resistance against the US dollar.
- The price is likely to decline below the $0.2880 support before it could start a fresh increase.
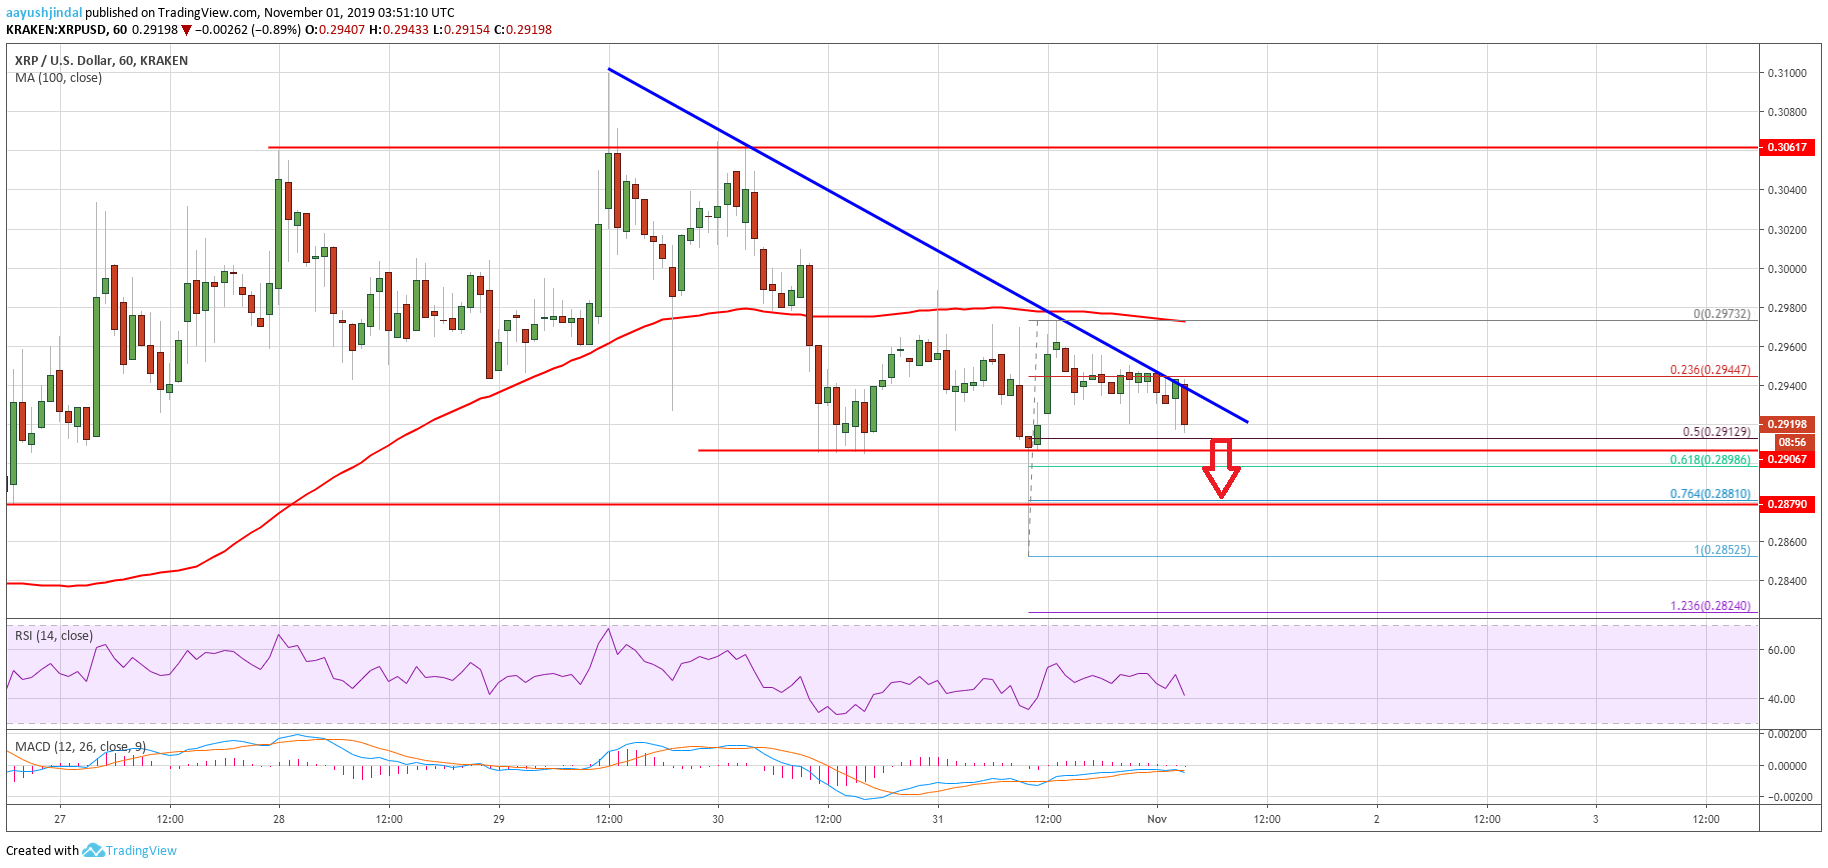
- There is a key bearish trend line forming with resistance near $0.2940 on the hourly chart of the XRP/USD pair (data source from Kraken).
- Ethereum is also declining, but it might find a strong support near the $175 level.
Ripple price is slowly declining below key supports against the US Dollar and bitcoin. XRP price might revisit the $0.2820 support before it could bounce back.
Ripple Price Analysis
After struggling to stay above $0.3050 and $0.3000, ripple started a slow and steady decline. XRP traded below the key $0.2950 support area to move into a short term bearish zone.
Moreover, there was a close below the $0.2950 level and the 100 hourly simple moving average. It opened the doors for more downsides and the price spiked below the $0.2880 support area.
The $0.2850 area provided support and the price recovered above $0.2920 and $0.2950. However, the price failed to stay above the $0.2950 level and even struggled to surpass the 100 hourly simple moving average.
A high was formed near $0.2972 and ripple is currently declining. It is trading near the $0.2920 support. An immediate support is near $0.2910, plus the 50% Fib retracement level of the upward move from the $0.2852 low to $0.2972 high.
The main supports are $0.2900, $0.2800, and the 61.8% Fib retracement level of the upward move from the $0.2852 low to $0.2972 high. If there is a downside break below the $0.2880 support, the price could revisit the $0.2850 and $0.2820 support levels.
On the upside, there are many hurdles near $0.2950 and $0.2980s. Additionally, there is a key bearish trend line forming with resistance near $0.2940 on the hourly chart of the XRP/USD pair. Therefore, an upside break above the $0.2950 level and the 100 hourly SMA is needed for a fresh upward move in the coming sessions.
Looking at the chart, ripple price is clearly declining below the key $0.2950 level. If the bulls fail to defend the $0.2880 support, there is a risk of more losses. The next key support is near $0.2820, below which the price may slide towards $0.2750. Conversely, a clear break above $0.2950 is needed for a decent recovery.
Technical Indicators
Hourly MACD – The MACD for XRP/USD is now moving back into the bearish zone.
Hourly RSI (Relative Strength Index) – The RSI for XRP/USD is now well below the 50 level, with a bearish angle.
Major Support Levels – $0.2900, $0.2880 and $0.2850.
Major Resistance Levels – $0.2940, $0.2950 and $0.3000.