
- Ripple price started a solid upward move and broke the key $0.4200 resistance against the US dollar.
- The price climbed higher and broke a few important resistances near $0.4350 and $0.4400.
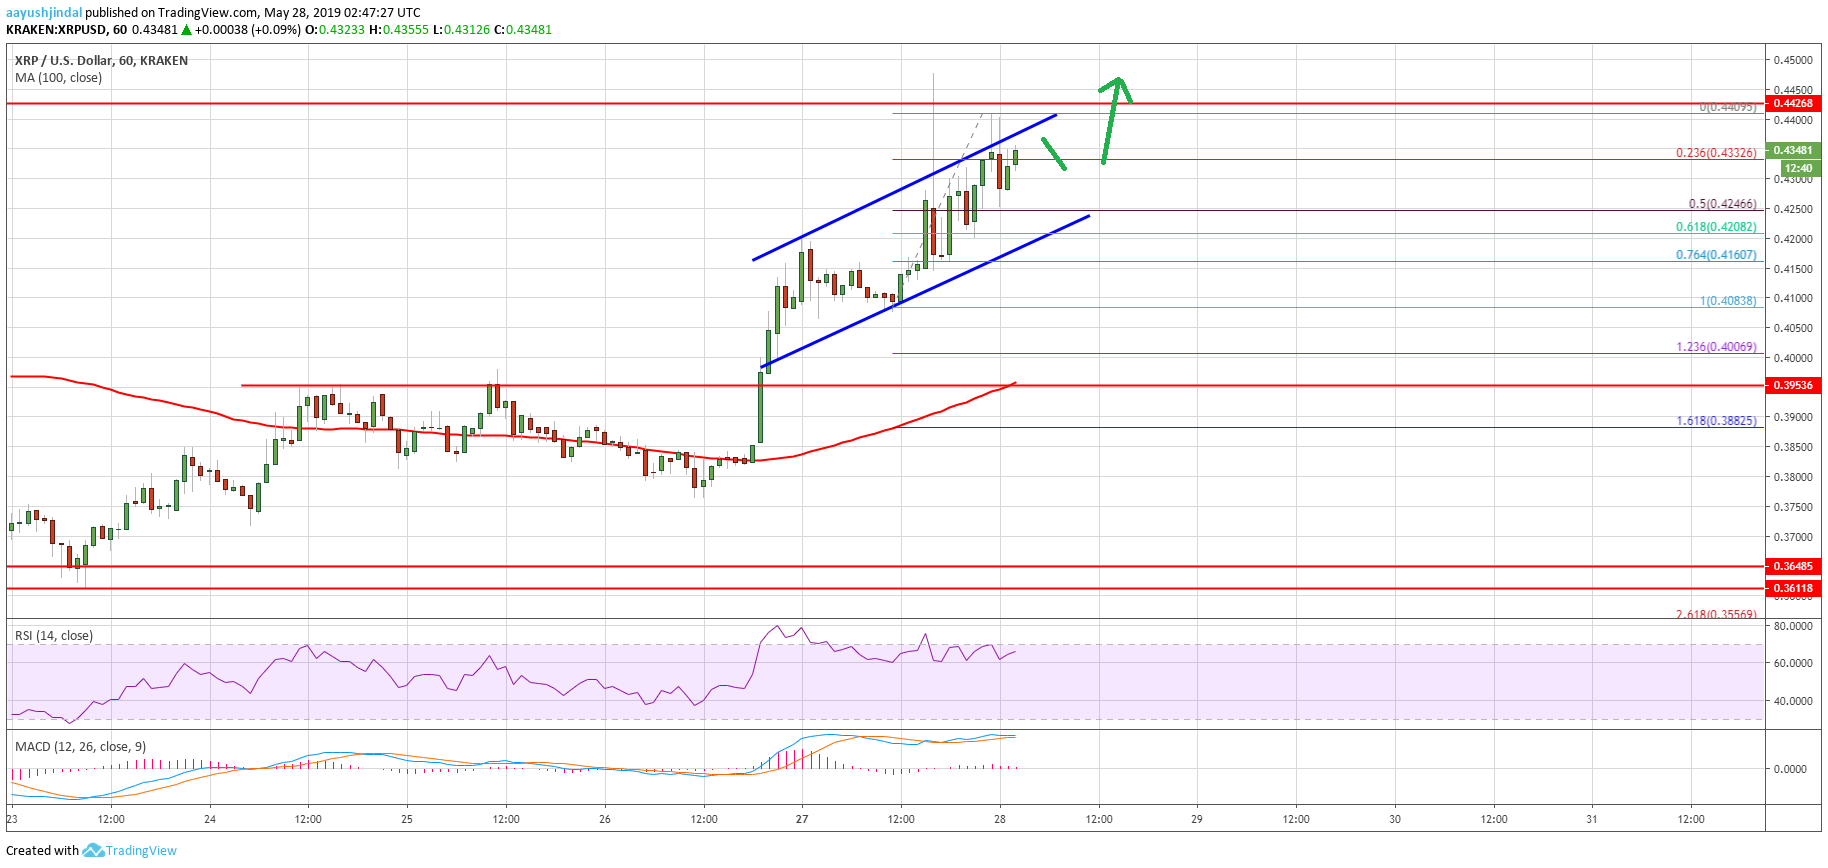
- There is a rising channel forming with support at $0.4240 on the hourly chart of the XRP/USD pair (data source from Kraken).
- The pair is eyeing further gains and it might soon clear the $0.4500 and $0.4650 resistance levels.
Ripple price is gaining bullish momentum against the US Dollar, while recovering vs bitcoin. XRP looks set to accelerate higher and it could continue to grind higher above $0.4500.
Ripple Price Analysis
Yesterday, there was a decent upward move in ripple price above the $0.4000 resistance against the US Dollar. The XRP/USD pair even settled above $0.4000 and the 100 hourly simple moving average. However, the $0.4200 area acted as a resistance and prevented further. Later, there was a downside correction, but the price stayed above the $0.4000 level. As a result, there was a fresh increase and the price was able to climb above the $0.4200 and $0.4250 resistance levels.
It opened the doors for more gains and the price rallied above the $0.4350 and $0.4400 levels. A new weekly high was formed near $0.4460 and a swing high was formed at $0.4409. The price is currently consolidating and recently declined below the 23.6% Fib retracement level of the recent wave from the $0.4083 low to $0.4409 swing high. On the downside, there are many supports near the $0.4250 level. Moreover, there is a rising channel forming with support at $0.4240 on the hourly chart of the XRP/USD pair.
The 50% Fib retracement level of the recent wave from the $0.4083 low to $0.4409 swing high is also near the channel support area. At the moment, the price is moving higher and it looks set for an upside break above the channel resistance. Once the bulls gain strength above $0.4500, there could be another rally. An immediate resistance is near the $0.4650 level, above which the price might test $0.4880.
Looking at the chart, ripple price is clearly gaining traction above $0.4080 and $0.4250. Therefore, there are possibilities of an upside extension above the $0.4650 level. If the bulls remain in action, the price could even aim the $0.5000 level in the coming sessions. On the downside, the main support is $0.4250, below which there may be an extended correction towards the $0.4080 level.
Technical Indicators
Hourly MACD – The MACD for XRP/USD is placed nicely in the bullish zone.
Hourly RSI (Relative Strength Index) – The RSI for XRP/USD is currently well above the 60 level, with positive signs.
Major Support Levels – $0.4250, $0.4150 and $0.4080.
Major Resistance Levels – $0.4450, $0.4500 and $0.4650.