

- Ripple price managed to stay above the $0.2850 support area against the US dollar.
- The price is currently facing a strong resistance near the $0.2900 and $0.2910 levels.
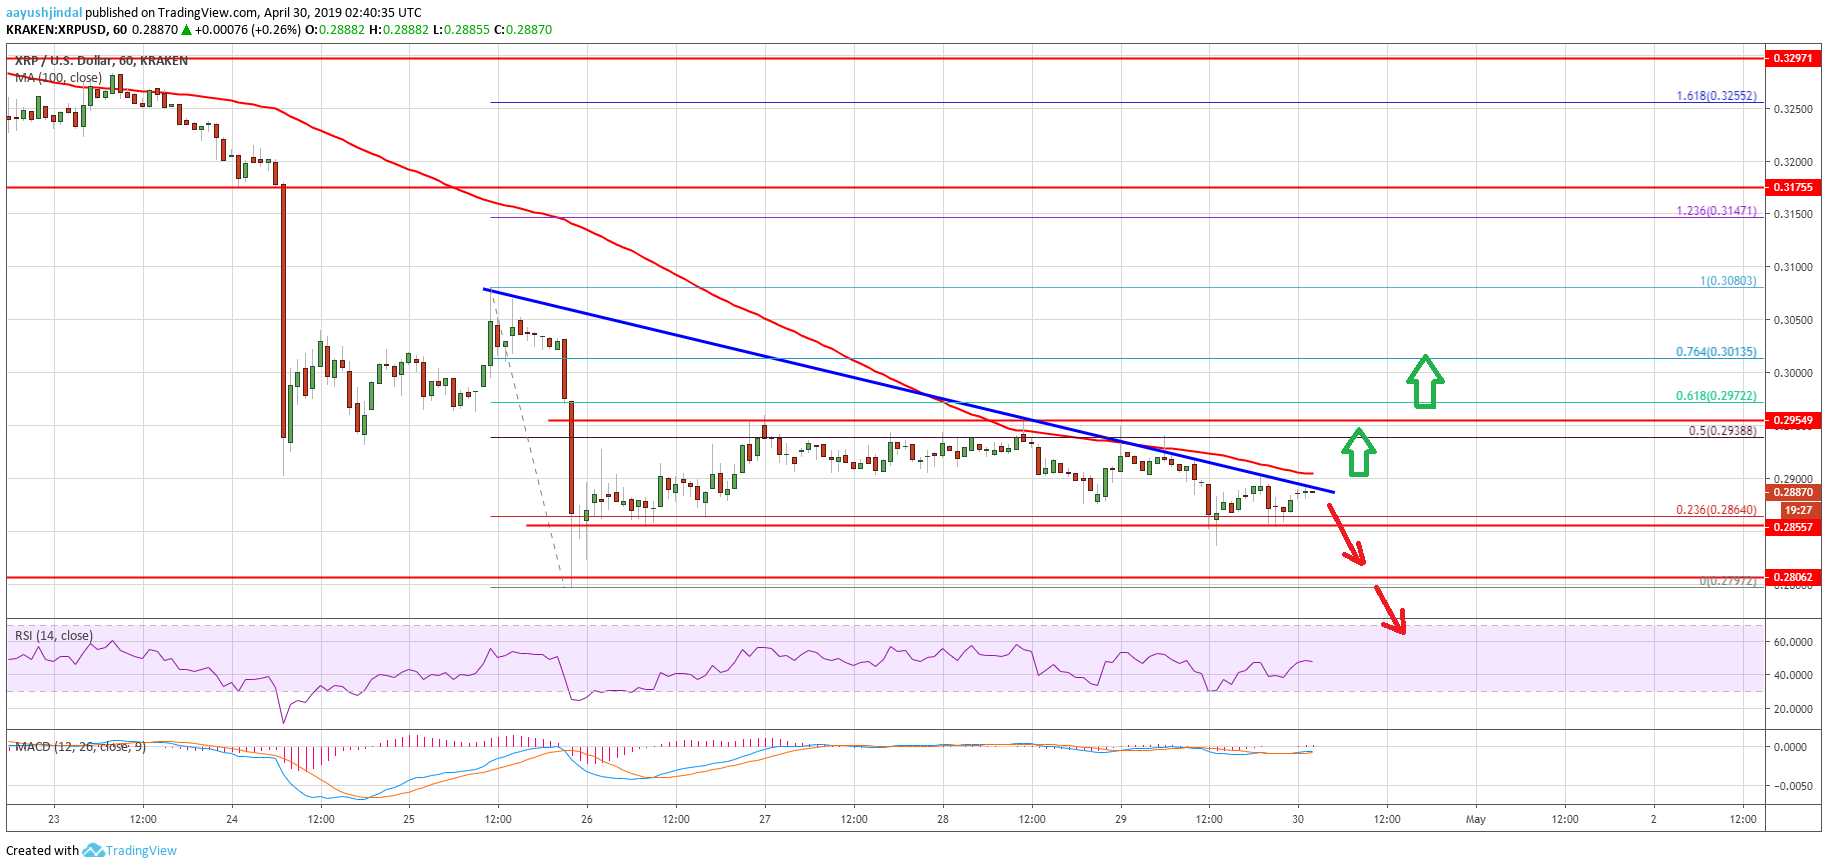
- There is a major bearish trend line in place with resistance near $0.2910 on the hourly chart of the XRP/USD pair (data source from Kraken).
- The pair could either recover above $0.2950 or start a fresh decline below the $0.2850 support.
Ripple price is currently consolidating in a tight range against the US Dollar and bitcoin. XRP is likely to make the next move either above $0.2950 or below $0.2850 in the near term.
Ripple Price Analysis
After a massive drop towards $0.2790, ripple price started a short term correction against the US Dollar. The XRP/USD pair traded as low as $0.2797 and recently recovered above the $0.2820 and $0.2850 levels. There was a break above the 23.6% Fib retracement level of the last decline from the $0.3080 high to $0.2797 low. The price even traded above the $0.2900 level, but it faced a strong resistance near the $0.2950 and $0.2955 levels.
It failed to clear the $0.2960 level and the 100 hourly simple moving average. Besides, there was a rejection near the 50% Fib retracement level of the last decline from the $0.3080 high to $0.2797 low. As a result, there was a fresh drop and the price retested the $0.2850 support level. At the moment, the price is slowly moving higher and testing the $0.2900 level plus the 100 hourly SMA. There is also a major bearish trend line in place with resistance near $0.2910 on the hourly chart of the XRP/USD pair.
Therefore, ripple seems to be preparing for the next break either above $0.2910 or below $0.2850. If there is an upside break above $0.2910 and the 100 hourly SMA, the price could recover towards the $0.2950 resistance. The next key resistance is near $0.3000 or the 76.4% Fib retracement level of the last decline from the $0.3080 high to $0.2797 low. Conversely, if there is no upside break above $0.2910, the price could collapse below the $0.2850 support area.

Looking at the chart, ripple price is clearly trading near important levels above $0.2850. As long as the price is above $0.2850, there are chances of a decent recovery towards the $0.2950 or $0.3000 levels. Having said that, a close above the $0.3050 and $0.3080 levels is must to move into a positive zone.
Technical Indicators
Hourly MACD – The MACD for XRP/USD is slowly moving in in the bullish zone.
Hourly RSI (Relative Strength Index) – The RSI for XRP/USD is moving higher and is currently above the 50 level.
Major Support Levels – $0.2860, $0.2850 and $0.2800.
Major Resistance Levels – $0.2950, $0.2960 and $0.3000.