
- Ripple price is facing a strong resistance near the $0.2740 and $0.2760 levels against the US dollar.
- The price is likely to continue lower unless there is a clear break above $0.2760.
- This week’s significant bearish trend line is still active with resistance near $0.2735 on the hourly chart of the XRP/USD pair (data source from Kraken).
- In addition, Ethereum is still consolidating and seems to be preparing for an upside break.
Ripple price is trading below key resistances against the US Dollar and bitcoin. XRP price could extend its decline below $0.2700 and $0.2680 in the near term.
Ripple Price Analysis
This week, ripple remained in a downtrend below the $0.2850 pivot level against the US Dollar. Moreover, XRP/USD broke many key supports near $0.2780 and settled below the 100 hourly simple moving average.
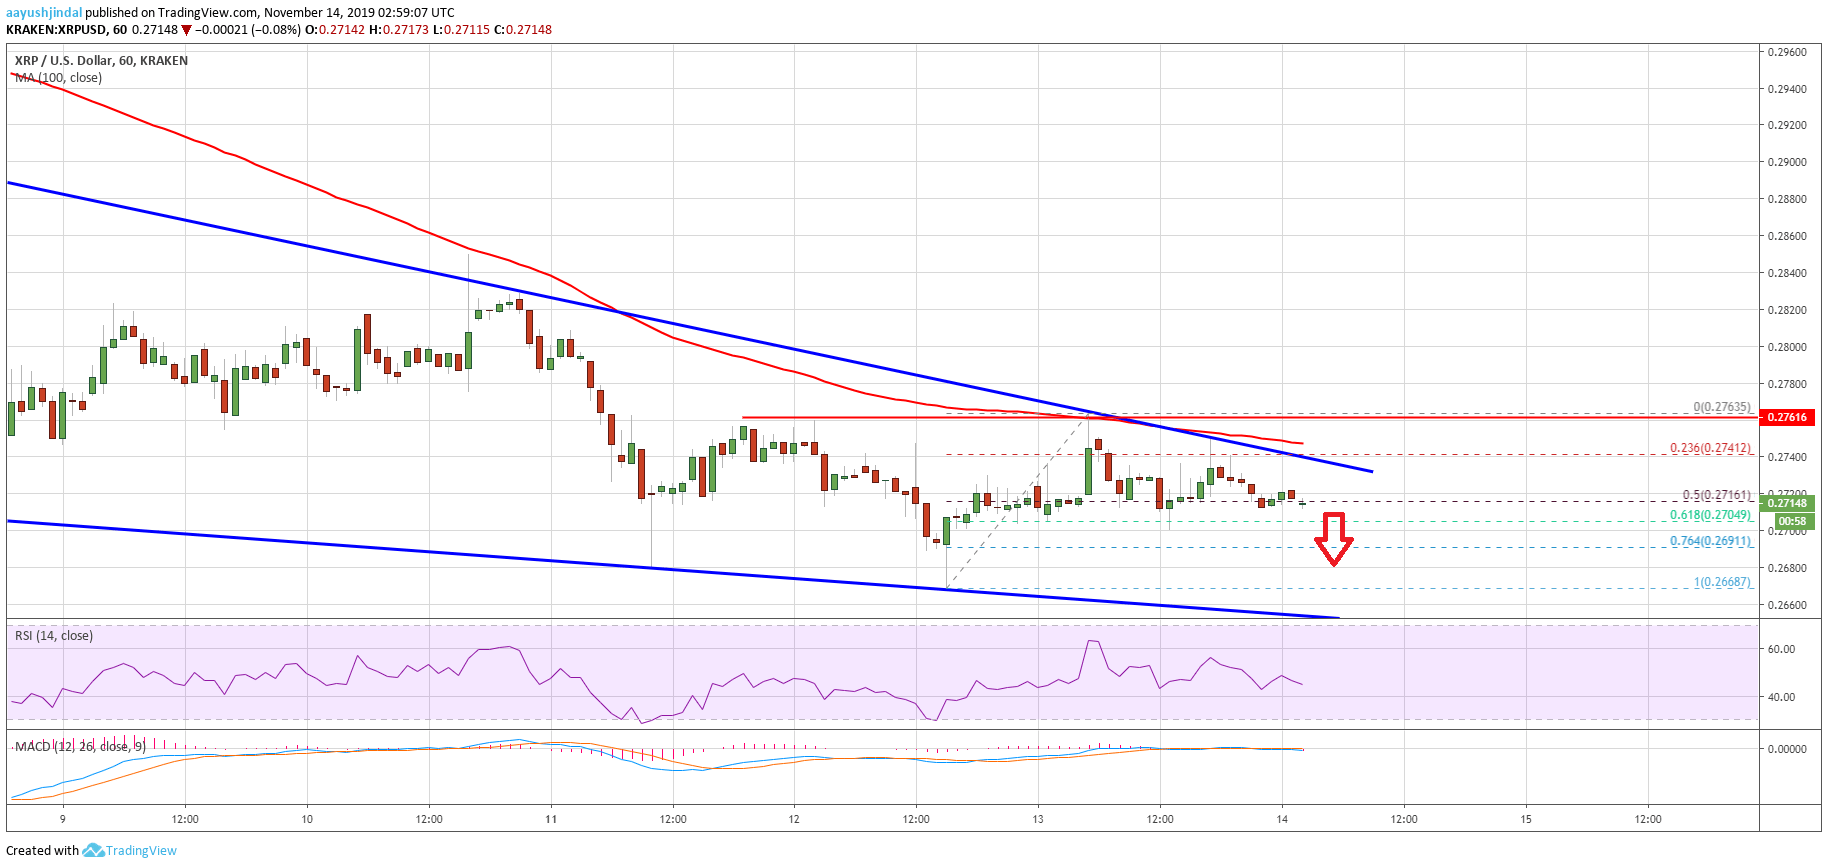
The last decline gained pace below $0.2700 and the price traded to a new monthly low at $0.2668. Later, there was an upside correction above the $0.2700 level. However, the price faced a strong resistance near the $0.2760 level and the 100 hourly SMA.
A high was formed near $0.2763 and the price is currently declining. Ripple is trading below the $0.2720 level and testing the 50% Fib retracement level of the upward move from the $0.2668 low to $0.2763 high.
On the downside, an immediate support is near the $0.2700 level. Besides, the 61.8% Fib retracement level of the upward move from the $0.2668 low to $0.2763 high is also near the $0.2700 area.
If there is a downside break below the $0.2700 support, the price could revisit $0.2665. Any further losses may perhaps push ripple price below the $0.2600 area. The next key support area is near the $0.2540 level.
On the upside, the price is facing a strong resistance near the $0.2740 and $0.2760 levels. More importantly, this week’s significant bearish trend line is still active with resistance near $0.2735 on the hourly chart of the XRP/USD pair.
Therefore, a clear break above the trend line, $0.2760, and the 100 hourly SMA is needed for a decent recovery in the near term. The next major resistance is near the $0.2850 level.
Looking at the chart, ripple price is trading in a bearish zone below the $0.2760 resistance area. For that reason, there is a risk of more downsides below $0.2700 and $0.2600 unless the bulls manage to push the price back above $0.2760 and $0.2800.
Technical Indicators
Hourly MACD – The MACD for XRP/USD is slowly gaining momentum in the bearish zone.
Hourly RSI (Relative Strength Index) – The RSI for XRP/USD is declining and moving below the 50 level.
Major Support Levels – $0.2700, $0.2660 and $0.2600.
Major Resistance Levels – $0.2740, $0.2750 and $0.2760.