
- Ripple price failed to stay above the $0.4450 pivot level and declined below $0.4200 against the US dollar.
- The price is currently under pressure and it could test the $0.3740 or $0.3400 support.
- This week’s followed ascending channel was breached with support near $0.4365 on the hourly chart of the XRP/USD pair (data source from Kraken).
- There are several supports on the downside near $0.3800, $0.3740 and $0.3720.
Ripple price trimmed most its recent gains against the US Dollar and bitcoin. XRP is currently below the $0.4200 support, but it is likely to find a strong support near $0.3740.
Ripple Price Analysis
This week, we saw a strong rise in ripple price above the $0.4000 and $0.4200 resistances against the US Dollar. The XRP/USD pair even broke the $0.4450 pivot level and traded to a new 2019 high at $0.4802. Later, there was a sharp downside correction from the $0.3802 high. The price traded below the $0.4450 pivot level to start a major downward move. It traded below the $0.4400 and $0.4200 support levels to move into a bearish zone.
More importantly, this week’s followed ascending channel was breached with support near $0.4365 on the hourly chart of the XRP/USD pair. The pair even broke the $0.4000 support and tested the $0.3740 support area. A swing low was formed at $0.3745 and the price recently bounced back. It rebounded above $0.4200 and the 50% Fib retracement level of the recent decline from the $0.4802 high to $0.3745 low. However, the previous support near the $0.4450 level acted as a strong resistance.
Besides, the price failed near the 61.8% Fib retracement level of the recent decline from the $0.4802 high to $0.3745 low. The price is currently moving lower and trading below $0.4000. An immediate support is near the $0.3950 level and the 100 hourly simple moving average. The main support is near the $0.3740 level, where the bulls are likely to protect additional losses. Below $0.3740, the price might decline towards the $0.3400 pivot level.
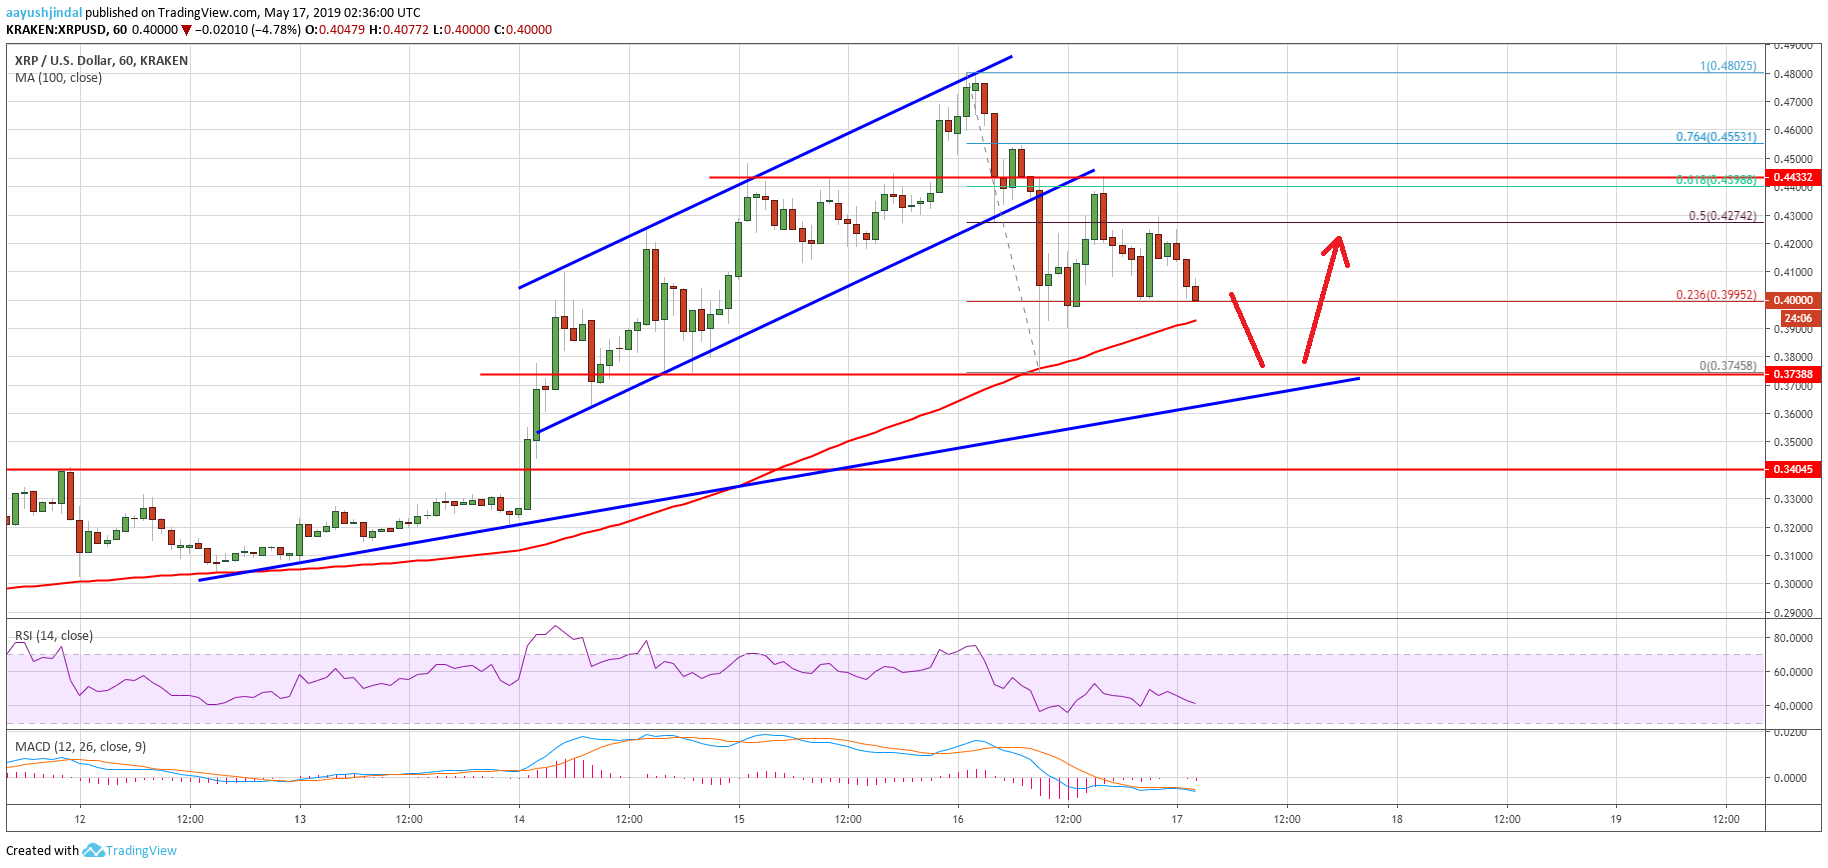

Looking at the chart, ripple price is clearly under pressure below the $0.4200 support level. There are chances that the price could revisit $0.3740 before starting a fresh increase. On the upside, an initial resistance is at $0.4200. The main hurdle is near the $0.4450, above which the price is likely to surge above the $0.4802 swing high.
Technical Indicators
Hourly MACD – The MACD for XRP/USD is slowly gaining pace in the bearish zone, with a few negative signs.
Hourly RSI (Relative Strength Index) – The RSI for XRP/USD is currently below the 50 level, with a bearish angle.
Major Support Levels – $0.3950, $0.3740 and $0.3400.
Major Resistance Levels – $0.4200, $0.4450 and $0.4800.