

- Ripple price is correcting lower and is trading below the $0.2750 pivot level against the US dollar.
- The price is holding the $0.2700 support area, but it is facing a strong resistance.
- There is a key bullish trend line forming with support near $0.2700 on the hourly chart of the XRP/USD pair (data source from Kraken).
- The price could extend its decline to $0.2650 before it starts a fresh increase above $0.2750.
Ripple price is struggling to continue higher against the US Dollar and bitcoin. XRP price might decline towards $0.2650 or $0.2620 before it could climb higher.
Ripple Price Analysis
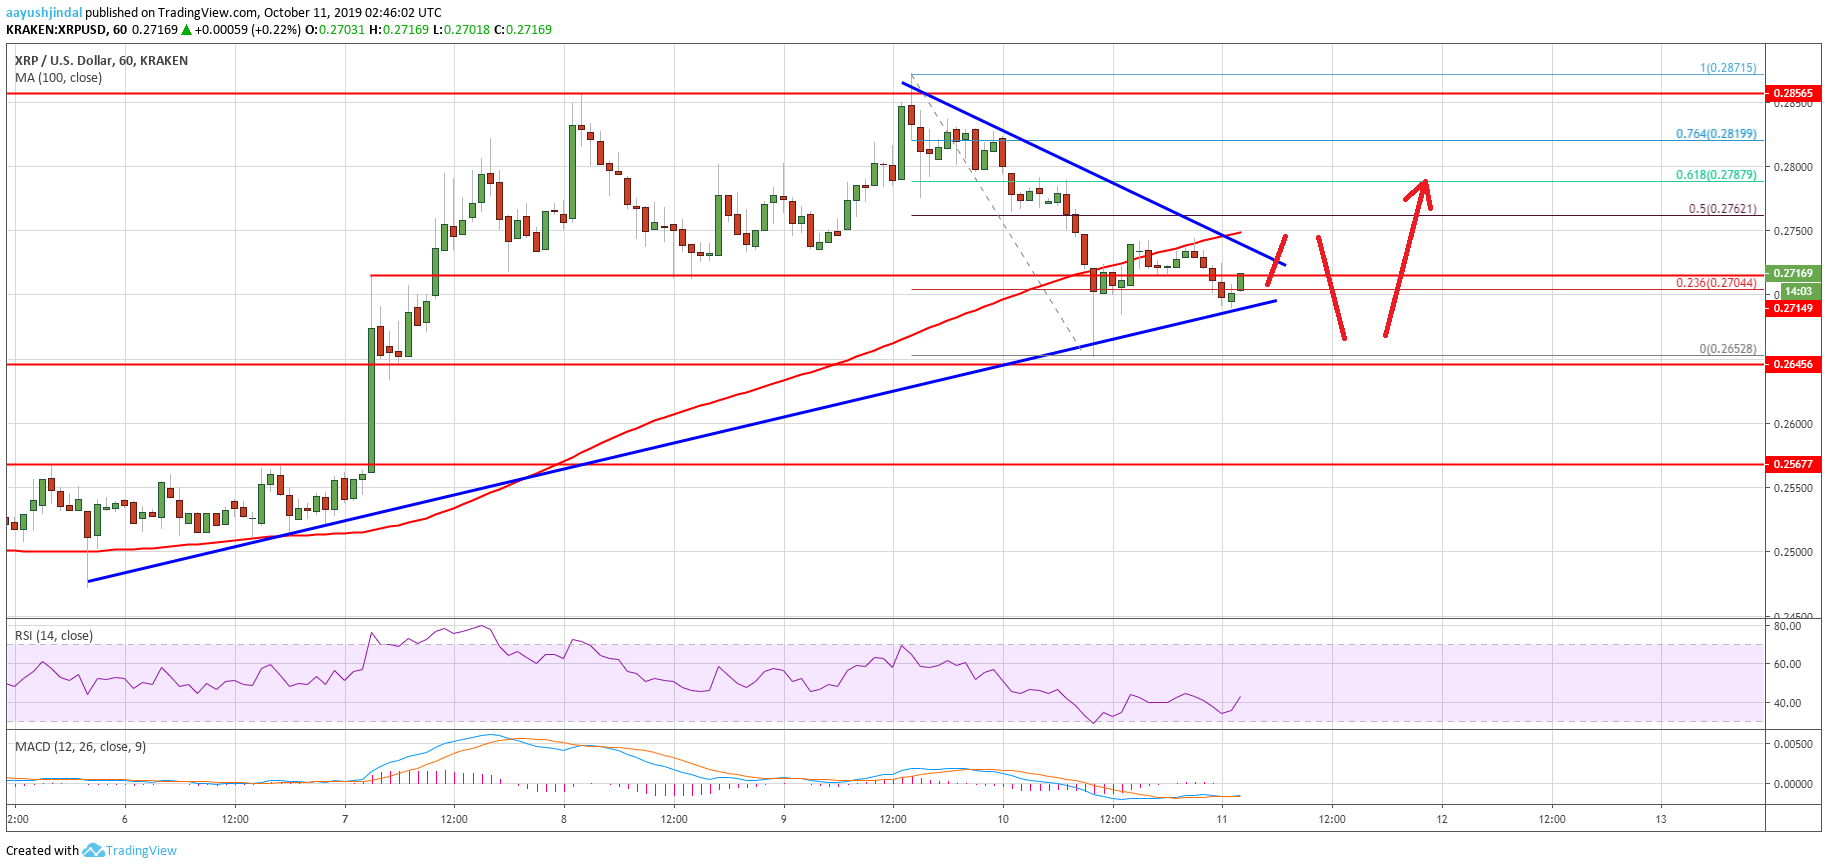
Yesterday, ripple price traded above the $0.2850 resistance against the US Dollar. XRP price traded to a new weekly high at $0.2871 and later started a downside correction. It broke the $0.2800 and $0.2750 support levels. Moreover, there was a close below the $0.2750 support area and the 100 hourly simple moving average. The bears gained pace and even pushed the price below the $0.2720 support.
The price tested the $0.2650 support area and it is currently correcting higher. It broke the $0.2700 level and the 23.6% Fib retracement level of the recent decline from the $0.2871 high to $0.2652 low. However, the previous support near the $0.2750 level is currently acting as a resistance. Additionally, the 100 hourly SMA is also preventing an upside break near $0.2750.
On the upside, the next key resistance is near the $0.2765 level. It coincides with the 50% Fib retracement level of the recent decline from the $0.2871 high to $0.2652 low. A successful break above the $0.2750 and $0.2765 resistance levels could start a fresh increase in ripple in the near term. The next key resistance is near the $0.2820 level, followed by the key $0.2850 barrier.
On the downside, the $0.2700 level is an immediate support. Moreover, there is a key bullish trend line forming with support near $0.2700 on the hourly chart of the XRP/USD pair. If there is a break below the trend line, the price could revisit the $0.2650 support area. Any further losses might push the price into a bearish zone towards $0.2600.
Looking at the chart, ripple price seems to be struggling to climb above the $0.2750 and $0.2765 resistance levels. If it continues to struggle, there could be another dip towards the $0.2650 level. However, as long as the price is above $0.2650, it could bounce back above $0.2750.
Technical Indicators
Hourly MACD – The MACD for XRP/USD is slowly moving into the bullish zone.
Hourly RSI (Relative Strength Index) – The RSI for XRP/USD is currently near the 40 level.
Major Support Levels – $0.2700, $0.2650 and $0.2600.
Major Resistance Levels – $0.2750, $0.2765 and $0.2820.