Reason to trust
How Our News is Made
Strict editorial policy that focuses on accuracy, relevance, and impartiality
Ad discliamer
Morbi pretium leo et nisl aliquam mollis. Quisque arcu lorem, ultricies quis pellentesque nec, ullamcorper eu odio.
Solana failed to settle above $132 and nosedived. SOL price is now consolidating losses below $130 and might decline further below $120.
- SOL price started a fresh decline below $130 and $128 against the US Dollar.
- The price is now trading below $128 and the 100-hourly simple moving average.
- There is a key bearish trend line forming with resistance at $131 on the hourly chart of the SOL/USD pair (data source from Kraken).
- The price could start a recovery wave if the bulls defend $122 or $120.
Solana Price Dips Again
Solana price failed to remain stable above $132 and started a fresh decline, like Bitcoin and Ethereum. SOL declined below the $130 and $128 support levels.
The price gained bearish momentum below $126. A low was formed at $121, and the price is now consolidating losses. The price recovered a few points and tested the 23.6% Fib retracement level of the downward move from the $134 swing high to the $121 low.
Solana is now trading below $128 and the 100-hourly simple moving average. On the upside, immediate resistance is near the $125 level. The next major resistance is near the $128 level or the 50% Fib retracement level of the downward move from the $134 swing high to the $121 low.
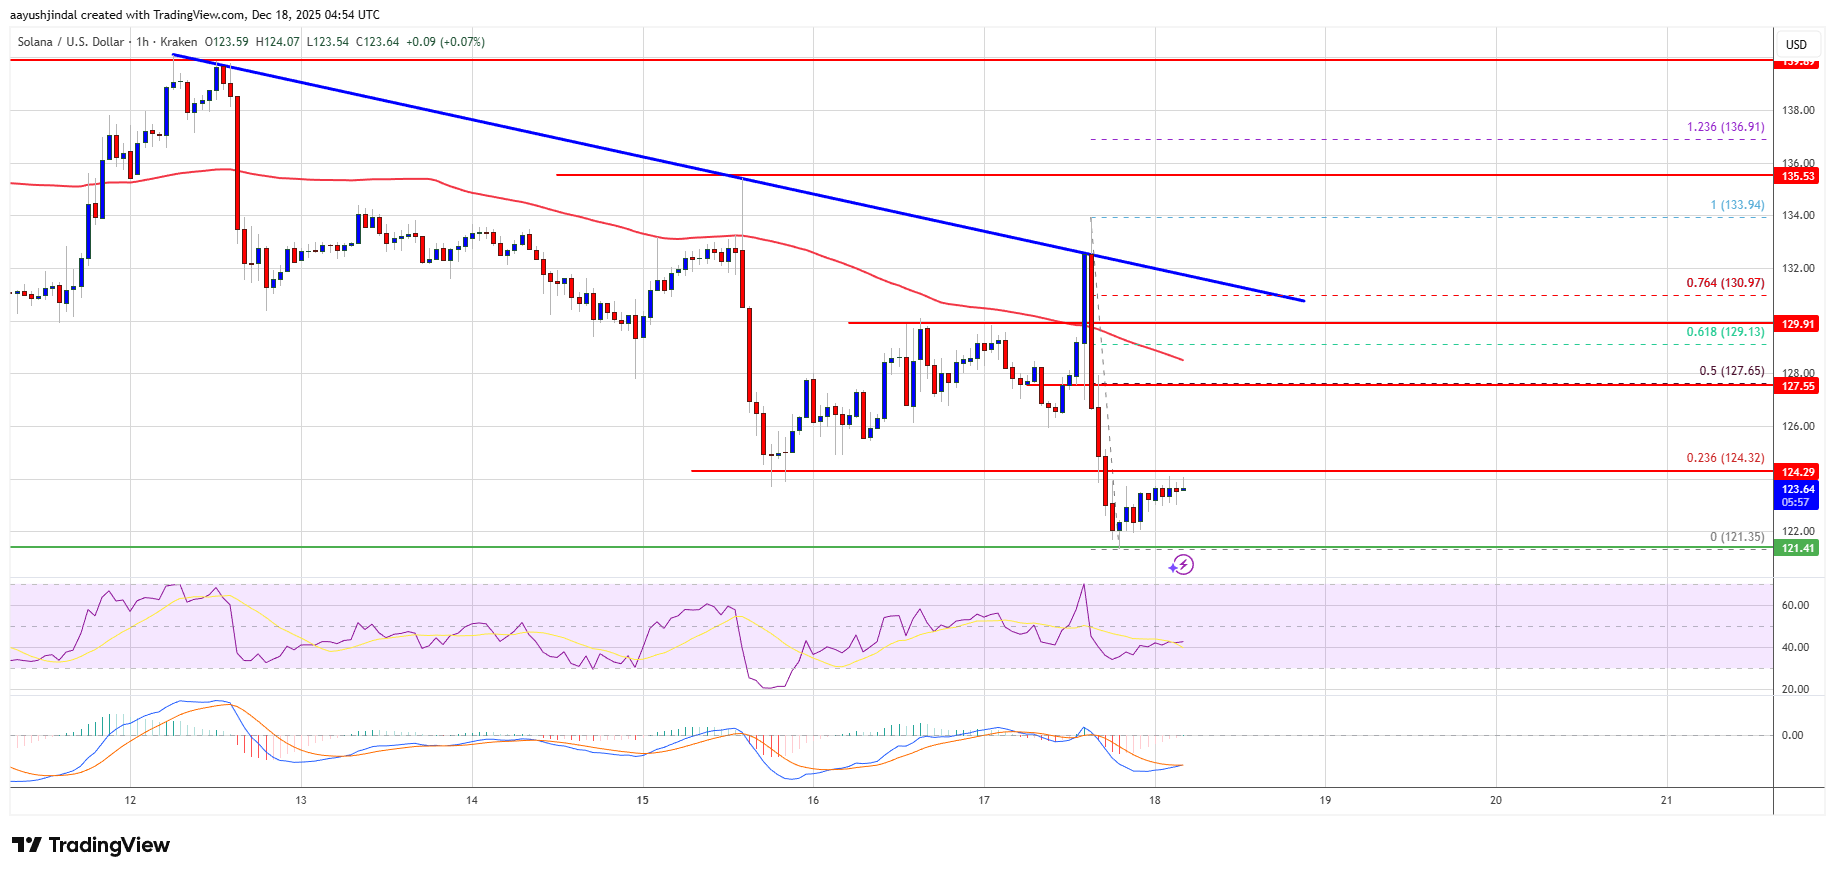
The main resistance could be $130. There is also a key bearish trend line forming with resistance at $131 on the hourly chart of the SOL/USD pair. A successful close above the $132 resistance zone could set the pace for another steady increase. The next key resistance is $140. Any more gains might send the price toward the $145 level.
Another Decline In SOL?
If SOL fails to rise above the $128 resistance, it could continue to move down. Initial support on the downside is near the $122 zone. The first major support is near the $120 level.
A break below the $120 level might send the price toward the $112 support zone. If there is a close below the $112 support, the price could decline toward the $105 support in the near term.
Technical Indicators
Hourly MACD – The MACD for SOL/USD is gaining pace in the bearish zone.
Hourly Hours RSI (Relative Strength Index) – The RSI for SOL/USD is below the 50 level.
Major Support Levels – $122 and $120.
Major Resistance Levels – $128 and $131.