Reason to trust
How Our News is Made
Strict editorial policy that focuses on accuracy, relevance, and impartiality
Ad discliamer
Morbi pretium leo et nisl aliquam mollis. Quisque arcu lorem, ultricies quis pellentesque nec, ullamcorper eu odio.
Ripple found support near $0.2320 and recovered higher above $0.2380 against the US Dollar. XRP price is consolidating gains and it could rally towards $0.2500.
- Ripple recovered nicely above the $0.2350 and $0.2380 resistance levels against the US dollar.
- The price is now trading above the $0.2400 resistance and the 100 hourly simple moving average.
- There was a break above a key bearish trend line with resistance near $0.2400 on the hourly chart of the XRP/USD pair (data source from Kraken).
- The pair is likely to continue higher if it clears the $0.2420 resistance zone.
Ripple Price is Showing Positive Signs
This past week, we saw a sharp decline in ripple below the $0.2400 support area. XRP price even broke the $0.2350 support and the 100 hourly simple moving average. It traded as low as $0.2310 and recently started a solid recovery wave.
There was a break above the $0.2350 and $0.2380 resistance levels. The price even climbed above the 50% Fib retracement level of the downward move from the $0.2472 high to $0.2310 low.
More importantly, there was a break above a key bearish trend line with resistance near $0.2400 on the hourly chart of the XRP/USD pair. The price is now trading above the $0.2400 resistance and the 100 hourly simple moving average.
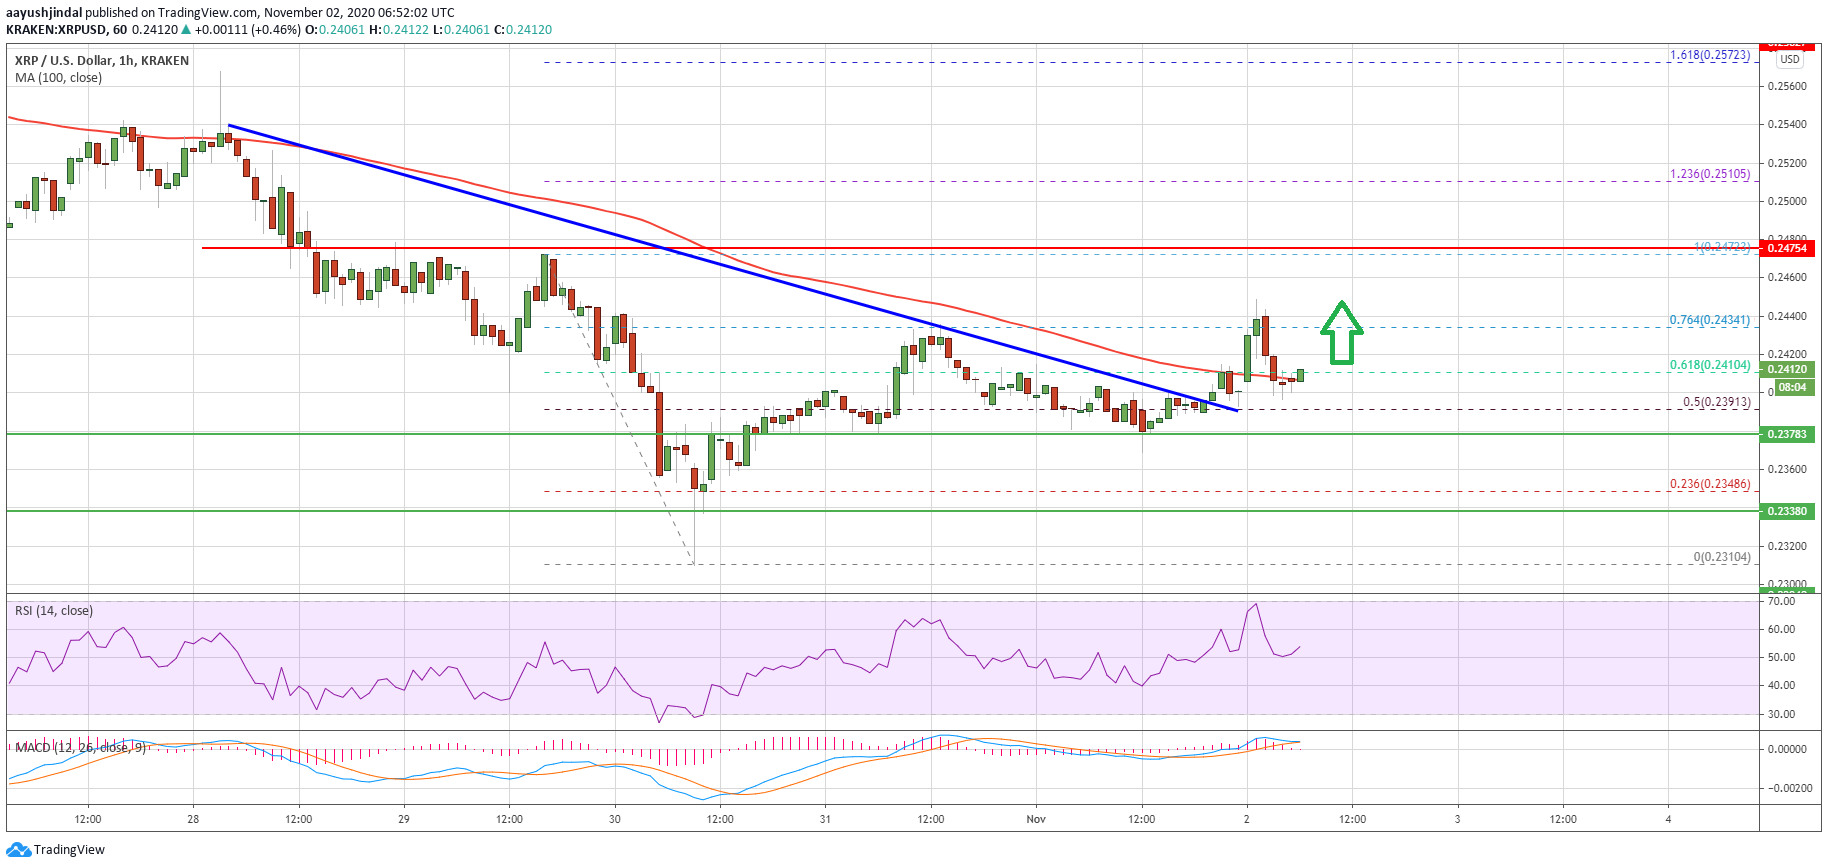
Source: XRPUSD on TradingView.com
An initial hurdle on the upside is near the $0.2420 level. The next resistance is near the 76.4% Fib retracement level of the downward move from the $0.2472 high to $0.2310 low. If there is a clear break above the $0.2420 and $0.2450 resistance levels, there is a risk of more upsides towards the $0.2480 and $0.2500 resistance levels.
Key Supports For XRP
The first key support for ripple is near the $0.2400 level and the broken trend line. The next key support is forming near the $0.2380 zone.
A successful break below the $0.2380 support level could put a lot of pressure on the bulls. In the stated case, the price may possibly revisit the $0.2320 support zone.
Technical Indicators
Hourly MACD – The MACD for XRP/USD is losing momentum in the bullish zone.
Hourly RSI (Relative Strength Index) – The RSI for XRP/USD is currently riding and it is above the 50 level.
Major Support Levels – $0.2400, $0.2380 and $0.2320.
Major Resistance Levels – $0.2420, $0.2450 and $0.2500.


