
Reason to trust
How Our News is Made
Strict editorial policy that focuses on accuracy, relevance, and impartiality
Ad discliamer
Morbi pretium leo et nisl aliquam mollis. Quisque arcu lorem, ultricies quis pellentesque nec, ullamcorper eu odio.
Ripple failed on more than two occasions near $0.2600 and $0.2640 against the US Dollar. XRP price could nosedive if there is a break below the $0.2500 support.
- Ripple traded as high as $0.2644 and recently corrected lower against the US dollar.
- The price is trading well above the $0.2500 support and the 100 simple moving average (4-hours).
- There is a crucial bullish trend line forming with support near $0.2515 on the 4-hours chart of the XRP/USD pair (data source from Kraken).
- The pair could start a strong rally if it clears the $0.2600 and $0.2640 levels in the near term.
Ripple’s XRP Price is Approaching Key Break
After finding bids near the $0.2440 and $0.2450 support level, ripple’s XRP price started a steady increase. The price broke the $0.2500 resistance zone and settled well above the 100 simple moving average (4-hours).
It even broke the $0.2600 resistance level. However, the bulls are still struggling to gain strength above the $0.2600 and $0.2640 resistance levels. A swing high was formed near $0.2644 before the price started a downside correction.
There was a break below the $0.2550 level, and the price traded below the 50% Fib retracement level of the recent upward move from the $0.2463 low to $0.2644 high.
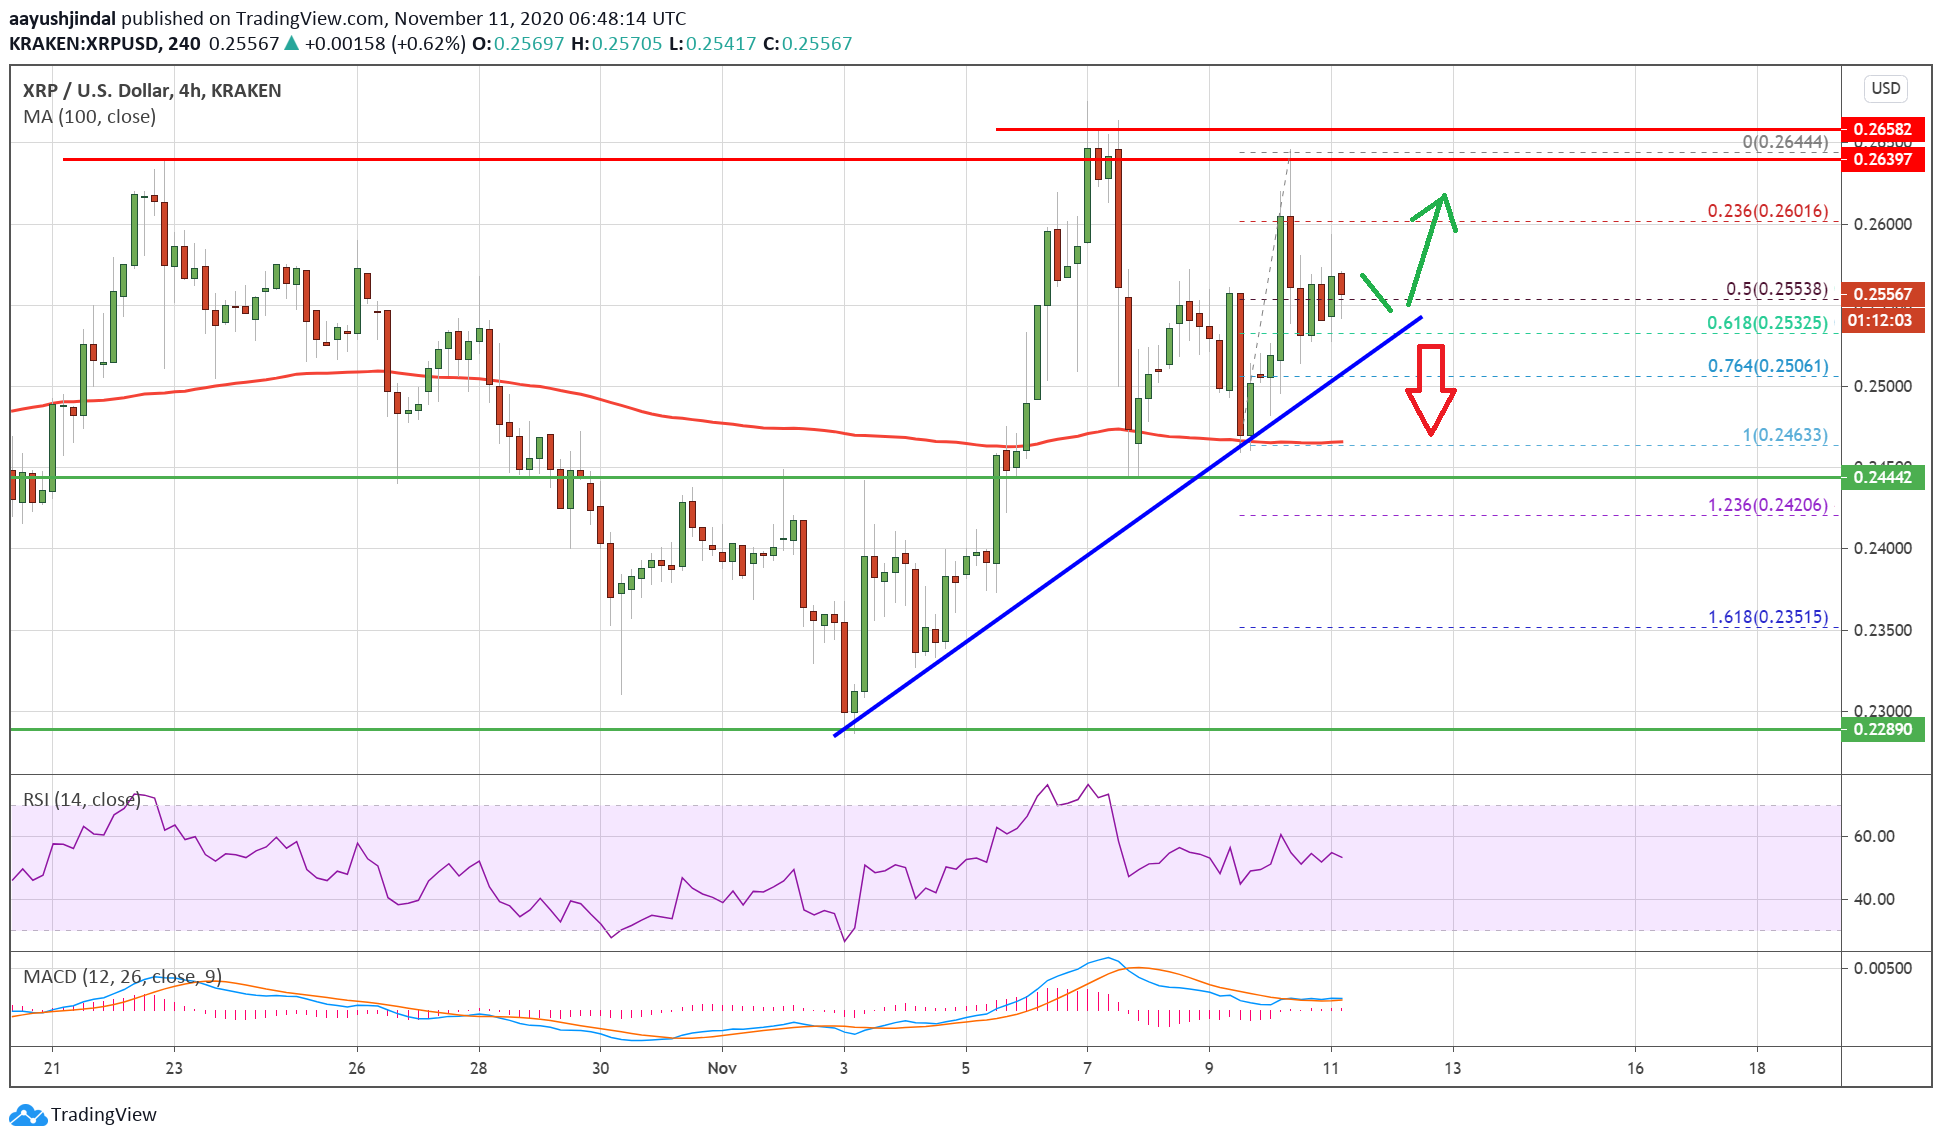
Source: XRPUSD on TradingView.com
The decline found support near the $0.2500 zone. The Fib retracement level of the recent upward move from the $0.2463 low to $0.2644 high is also acting as a support. More importantly, there is a crucial bullish trend line forming with support near $0.2515 on the 4-hours chart of the XRP/USD pair.
On the upside, the price is clearly facing a huge resistance near $0.2600 and $0.2640. If there is a successful break above the $0.2640 resistance zone, the price might start a strong rally. The next major resistance could be near $0.2720, followed by $0.2800.
Key Support for XRP
If ripple fails to clear the $0.2600 and $0.2640 resistance levels, there is a risk of a bearish breakdown. The first key support is near the trend line and the $0.2500 level.
The next major support is near the $0.2460 level and the 100 simple moving average (4-hours), below which the price might dive towards the $0.2300 support.
Technical Indicators
4-Hours MACD – The MACD for XRP/USD is slowly moving in the bullish zone.
4-Hours RSI (Relative Strength Index) – The RSI for XRP/USD is currently just above the 50 level.
Major Support Levels – $0.2515, $0.2500 and $0.2460.
Major Resistance Levels – $0.2600, $0.2640 and $0.2720.


