Reason to trust
How Our News is Made
Strict editorial policy that focuses on accuracy, relevance, and impartiality
Ad discliamer
Morbi pretium leo et nisl aliquam mollis. Quisque arcu lorem, ultricies quis pellentesque nec, ullamcorper eu odio.
XRP price started a fresh increase above $2.250. The price is now showing positive signs but faces a major hurdle near the $2.60 level.
- XRP price is attempting a recovery wave above the $2.50 zone.
- The price is now trading below $2.60 and the 100-hourly Simple Moving Average.
- There is a key bearish trend line forming with resistance at $2.660 on the hourly chart of the XRP/USD pair (data source from Kraken).
- The pair could start a fresh decline if it settles below $2.70.
XRP Price Starts Recovery
XRP price found support and started a strong recovery wave above $2.0, like Bitcoin and Ethereum. The price was able to climb above the $2.20 and $2.25 levels to enter a positive zone.
There was a decent increase above the 61.8% Fib retracement level of the downward move from the $3.05 swing high to the $1.40 swing low. However, the price could face hurdles near $2.60. There is also a key bearish trend line forming with resistance at $2.660 on the hourly chart of the XRP/USD pair.
The price is now trading below $2.60 and the 100-hourly Simple Moving Average. If there is a fresh upward move, the price might face resistance near the $2.60 level.
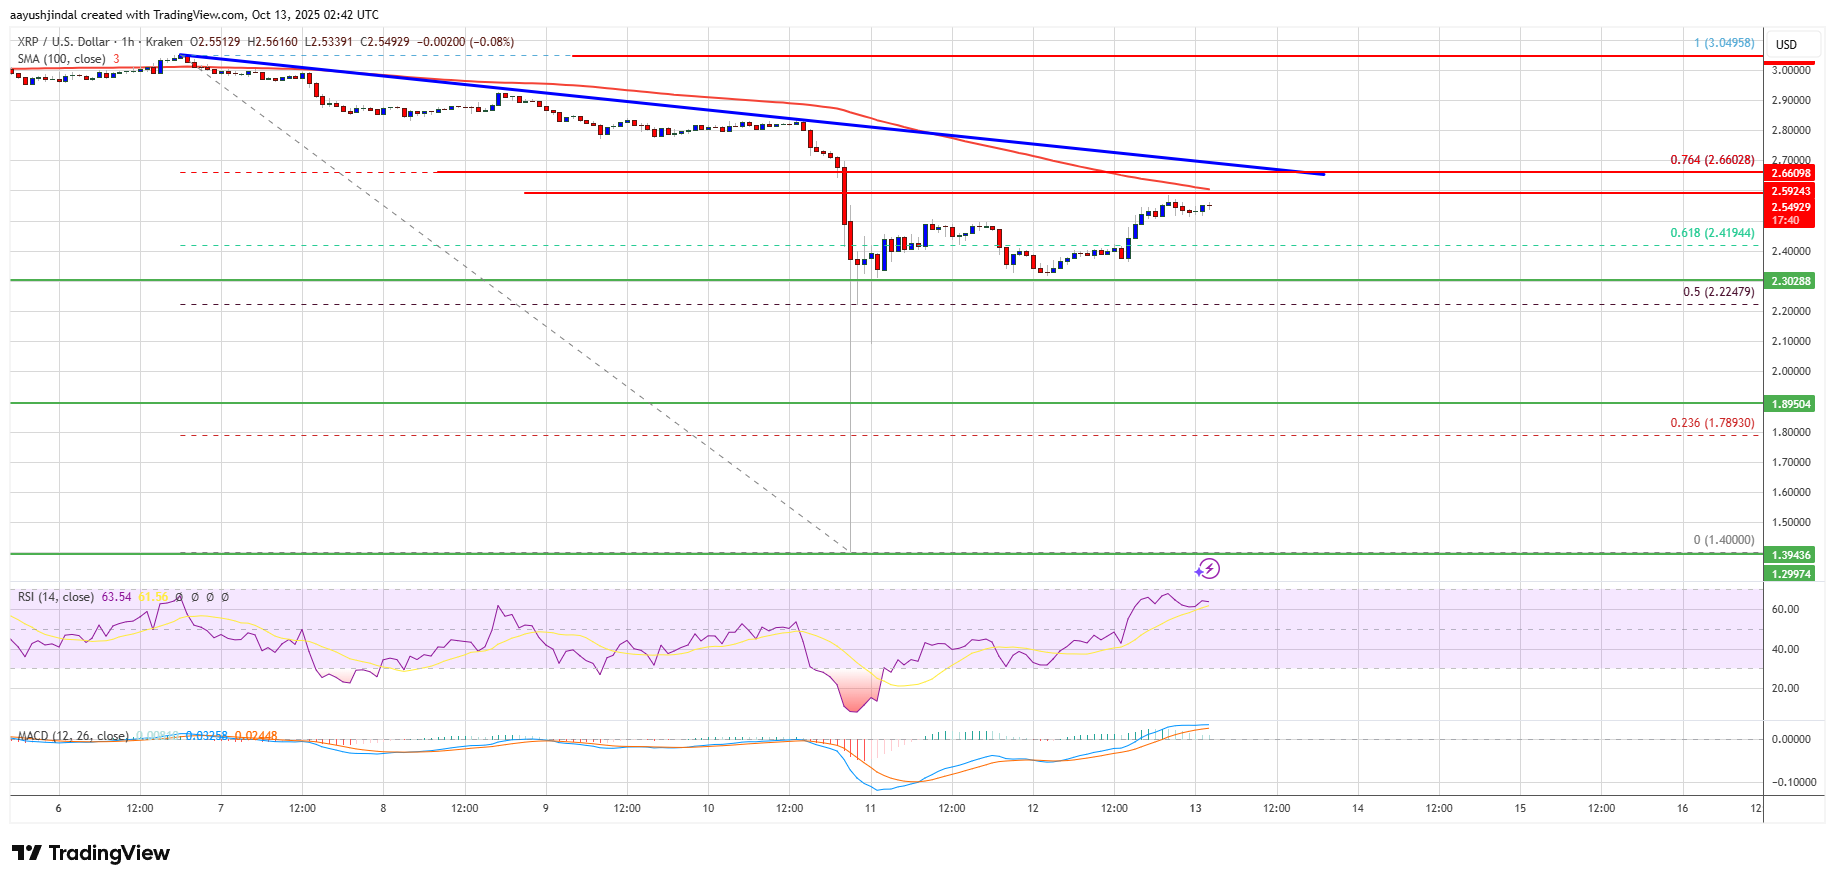
The first major resistance is near the $2.660 level and the trend line. It is close to the 76.4% Fib retracement level of the downward move from the $3.05 swing high to the $1.40 swing low. A clear move above the $2.660 resistance might send the price toward the $2.70 resistance. Any more gains might send the price toward the $2.720 resistance. The next major hurdle for the bulls might be near $2.80.
Another Decline?
If XRP fails to clear the $2.60 resistance zone, it could start a fresh decline. Initial support on the downside is near the $2.450 level. The next major support is near the $2.40 level.
If there is a downside break and a close below the $2.40 level, the price might continue to decline toward $2.320. The next major support sits near the $2.30 zone, below which the price could continue lower toward $2.250.
Technical Indicators
Hourly MACD – The MACD for XRP/USD is now gaining pace in the bullish zone.
Hourly RSI (Relative Strength Index) – The RSI for XRP/USD is now above the 50 level.
Major Support Levels – $2.450 and $2.40.
Major Resistance Levels – $2.60 and $2.660.