Reason to trust
How Our News is Made
Strict editorial policy that focuses on accuracy, relevance, and impartiality
Ad discliamer
Morbi pretium leo et nisl aliquam mollis. Quisque arcu lorem, ultricies quis pellentesque nec, ullamcorper eu odio.
XRP price is holding above $2.920 support zone. The price is now consolidating and might soon attempt a move above the $3.050 resistance.
- XRP price is showing bearish signs below the $3.080 resistance.
- The price is now trading near $2.980 and the 100-hourly Simple Moving Average.
- There was a break below a key contracting triangle with support at $3.020 on the hourly chart of the XRP/USD pair (data source from Kraken).
- The pair could continue to decline if it stays below the $3.10 zone.
XRP Price Starts Consolidation
XRP price started a downside correction from $3.0850, like Bitcoin and Ethereum. The price traded below the $3.050 and $3.000 levels.
The price dipped below the 23.6% Fib retracement level of the upward move from the $2.824 swing low to the $3.080 high. Besides, there was a break below a key contracting triangle with support at $3.020 on the hourly chart of the XRP/USD pair.
However, the price found support near the $2.950 zone. It seems like the bulls are protecting the 50% Fib retracement level of the upward move from the $2.824 swing low to the $3.080 high. The price is now trading near $2.980 and the 100-hourly Simple Moving Average. If the bulls remain in action, the price could attempt another increase.
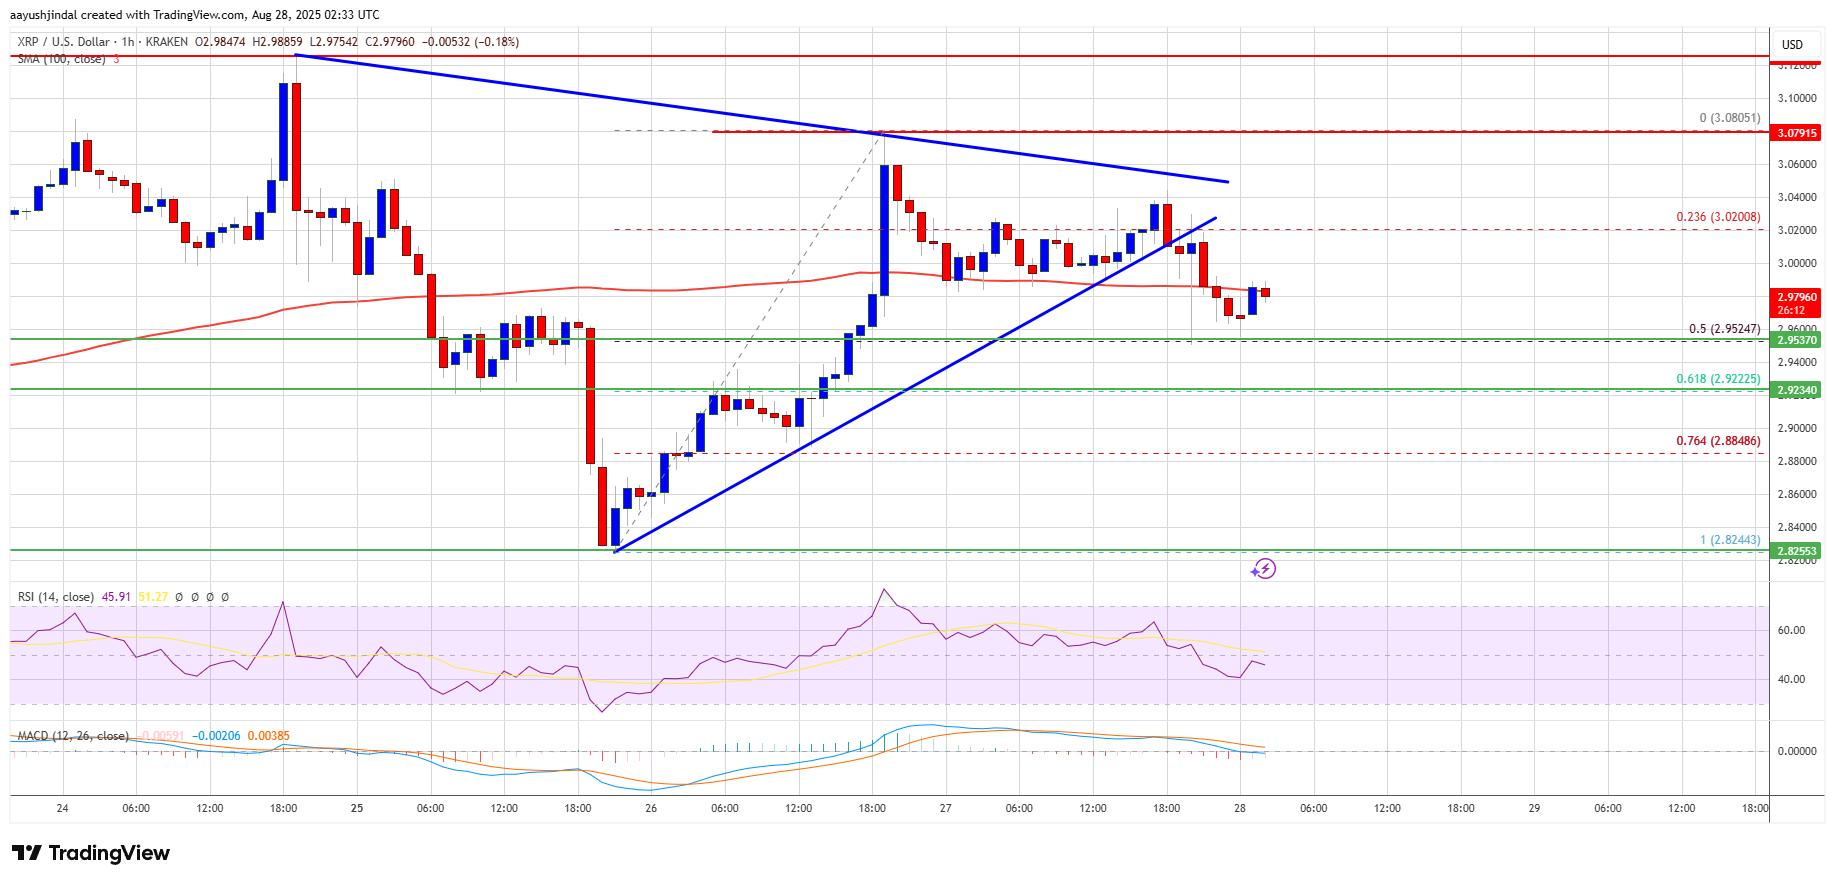
On the upside, the price might face resistance near the $3.020 level. The first major resistance is near the $3.080 level. A clear move above the $3.080 resistance might send the price toward the $3.120 resistance. Any more gains might send the price toward the $3.150 resistance. The next major hurdle for the bulls might be near $3.20.
Another Decline?
If XRP fails to clear the $3.080 resistance zone, it could start a fresh decline. Initial support on the downside is near the $2.950 level. The next major support is near the $2.9220 level.
If there is a downside break and a close below the $2.9220 level, the price might continue to decline toward $2.840. The next major support sits near the $2.780 zone, below which the price could gain bearish momentum.
Technical Indicators
Hourly MACD – The MACD for XRP/USD is now losing pace in the bearish zone.
Hourly RSI (Relative Strength Index) – The RSI for XRP/USD is now below the 50 level.
Major Support Levels – $2.920 and $2.840.
Major Resistance Levels – $3.080 and $3.120.