

Avalanche (AVAX) has experienced a significant price increase, surpassing a crucial barrier in recent trading sessions. In the past 24 hours, AVAX saw a 6% rise, while its weekly chart shows a notable appreciation of over 17%.
However, the technical outlook for Avalanche suggests mixed signals with a slight inclination toward bearish momentum in the market. Although there have been attempts to recover demand, it has not shown significant improvement, and accumulation remains low according to the chart.
While Bitcoin has re-entered the $30,000 price level, leading to optimism in the altcoin market, including Avalanche, it is important to note that Avalanche and other altcoins have not completely overcome their challenges.
Related Reading: AVAX Breaches $13 Barrier With 16% Rally – What’s The Next Price Level To Watch?
For AVAX to see a bullish trend, it must surpass a crucial barrier of $13, allowing the bulls to gain control of the price. Additionally, the stability of Bitcoin’s price is essential for overall market strength. AVAX has experienced a decline in market capitalization, indicating reduced buying power reflected on the chart.
Avalanche Price Analysis: One-Day Chart

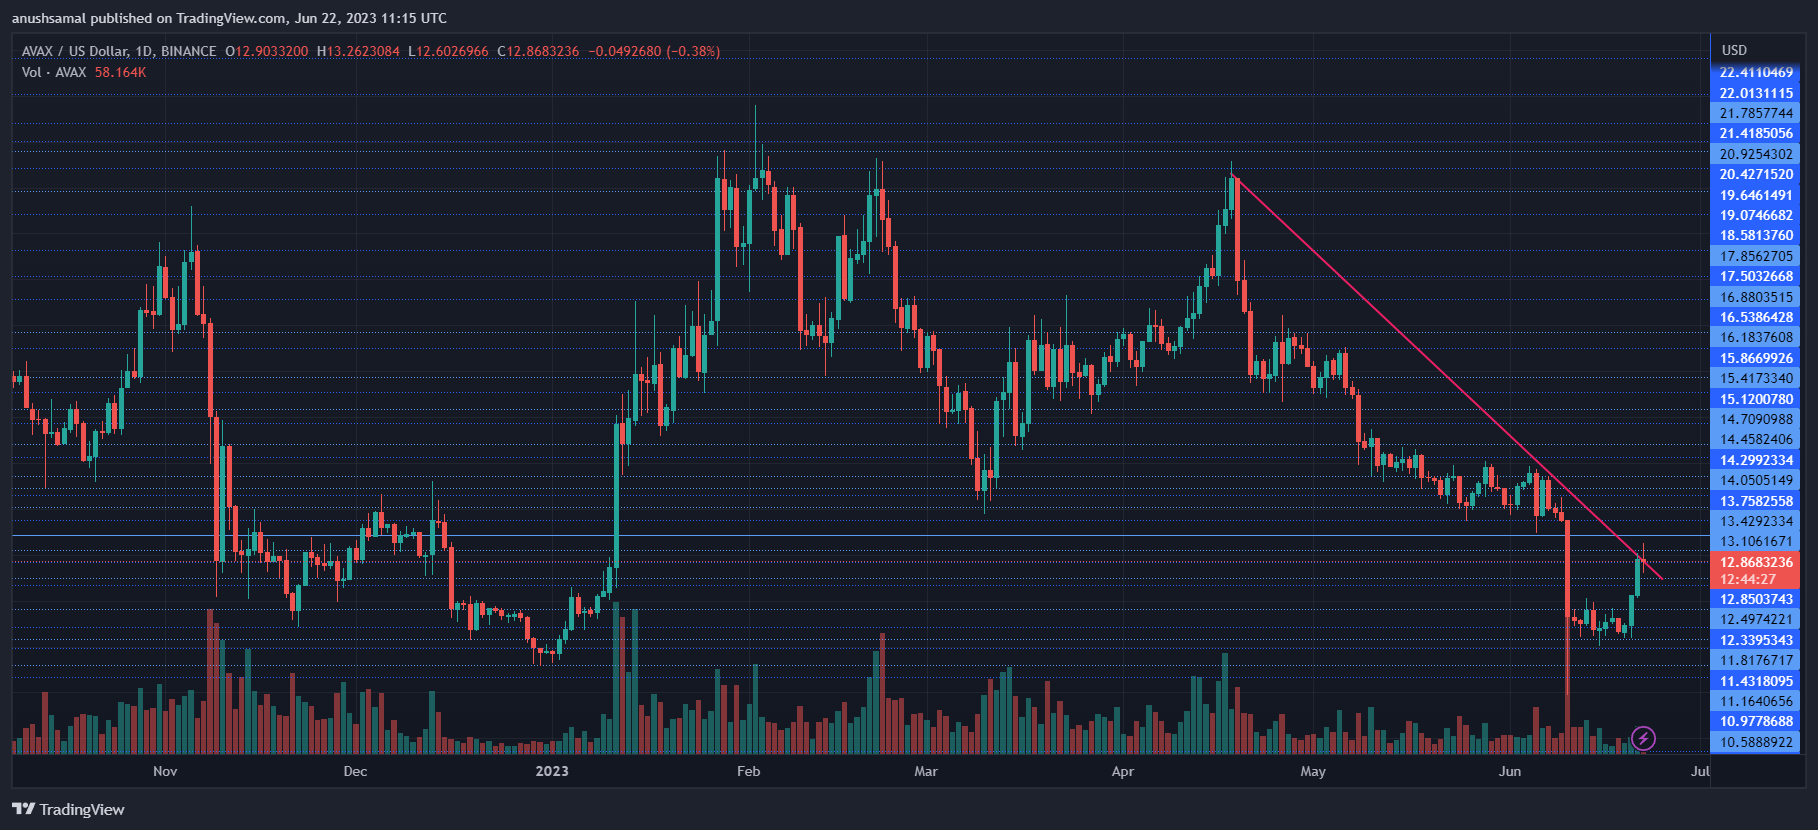
At the time of writing, AVAX was trading at $12.90. Avalanche is currently making efforts to prevent a depreciation in its price following its breakthrough of the $12 resistance level.
Although AVAX briefly moved above $13, it experienced a slight decline in its value during recent trading sessions. In order for the bulls to take control, Avalanche needs to surpass the $13 mark and breach the resistance level of $15.
If AVAX continues to trade around the current price level, it may be pushed towards its nearest support at $12.40, and potentially even below $12. This is because the volume of AVAX traded in the last session was red, indicating strong selling pressure.
Technical Analysis

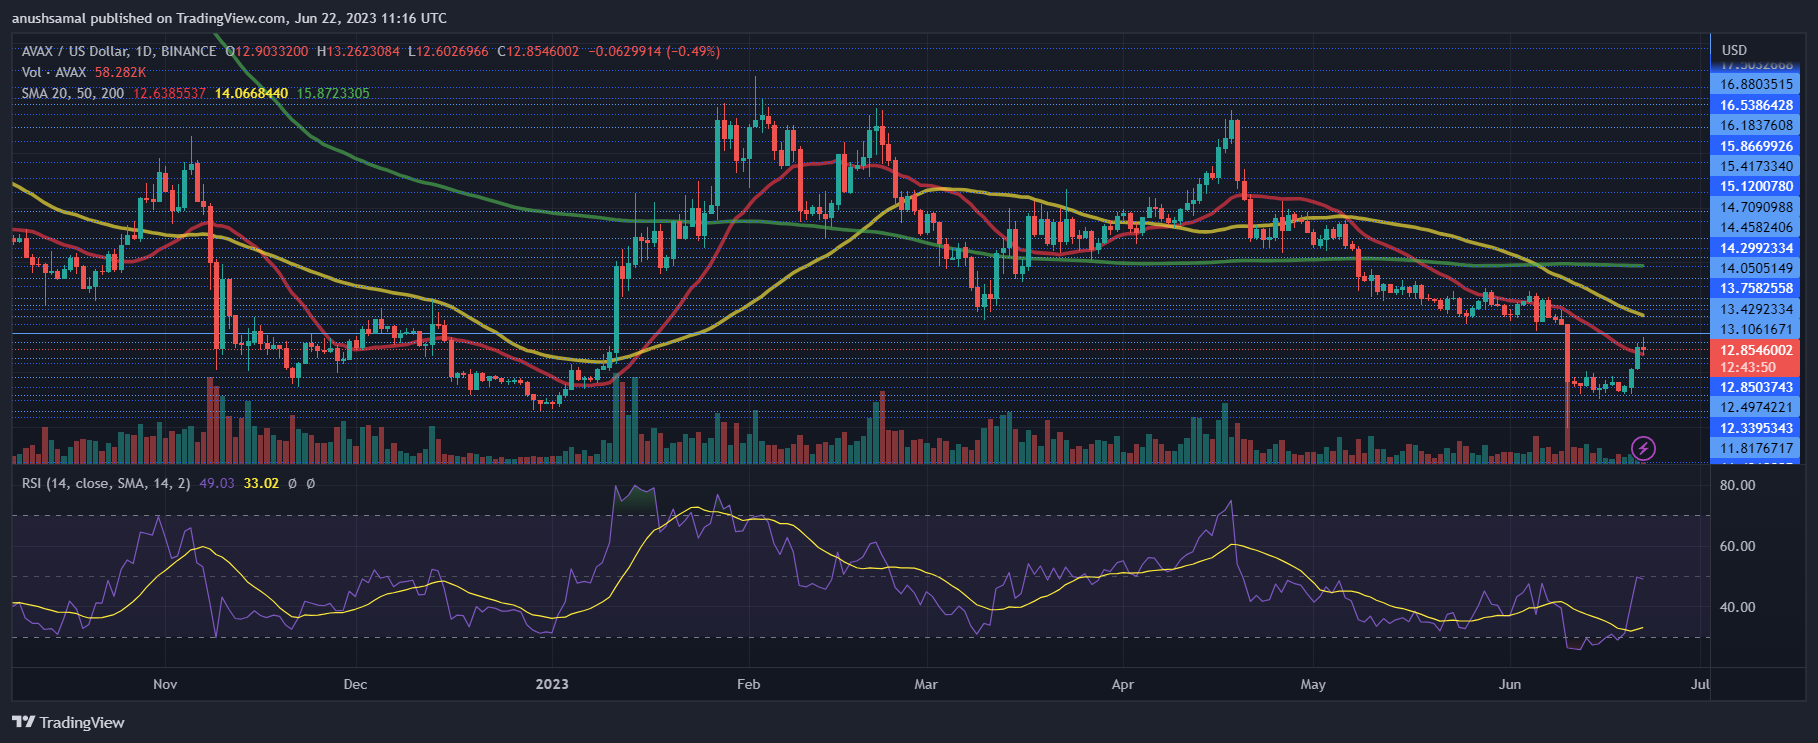
Following AVAX’s successful breach of the $12 level, there was a gradual recovery in buying strength. However, at the current moment, selling strength has taken over.
This is indicated by the Relative Strength Index (RSI) being below the halfway line, suggesting that sellers have the upper hand in the market.
Additionally, AVAX has dipped below the 20-Simple Moving Average line, further confirming the dominance of sellers in driving the price momentum. For demand to revive, it is crucial for AVAX to rise above the $13 level and sustain that upward movement
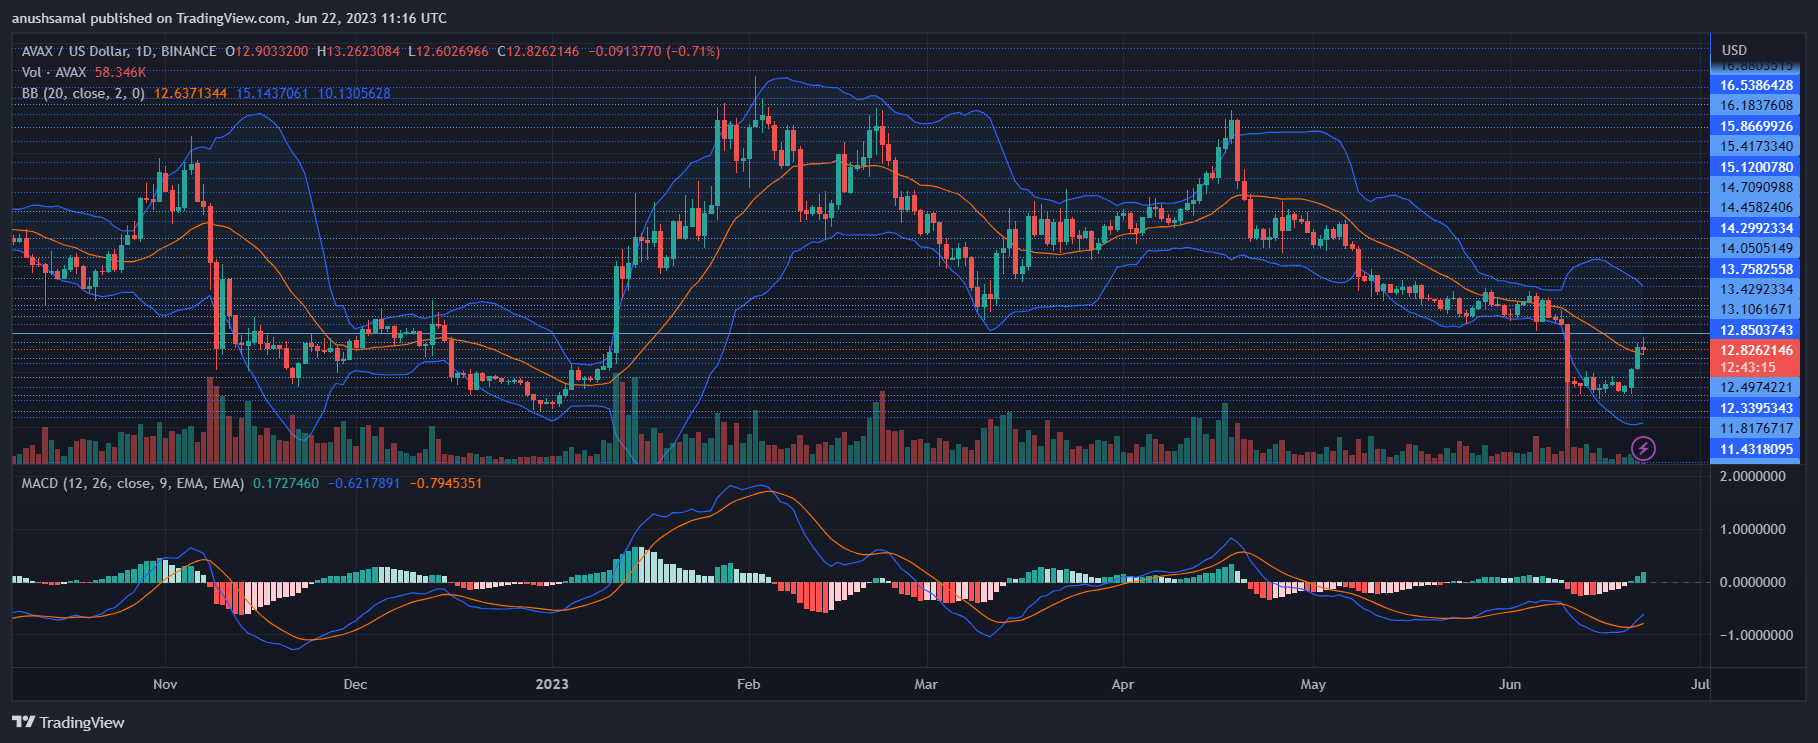
On the one-day chart, AVAX has shown buy signals, suggesting a possible price reversal. The Moving Average Convergence Divergence (MACD) has formed green histograms, indicating positive price momentum and potential buying opportunities.
However, these buy signals may diminish if the price fails to stay above the $13 resistance level. In terms of price volatility and fluctuation, the Bollinger Bands have widened. This widening indicates that AVAX may experience increased volatility in the upcoming trading sessions.