Reason to trust
How Our News is Made
Strict editorial policy that focuses on accuracy, relevance, and impartiality
Ad discliamer
Morbi pretium leo et nisl aliquam mollis. Quisque arcu lorem, ultricies quis pellentesque nec, ullamcorper eu odio.
Solana started a fresh decline and retested the $145 support zone. SOL price is now recovering and might aim for a fresh increase above the $150 zone.
- SOL price started a fresh decline after it failed to clear $160 against the US Dollar.
- The price is now trading below $150 and the 100-hourly simple moving average.
- There was a break above a key bearish trend line with resistance at $147 on the hourly chart of the SOL/USD pair (data source from Kraken).
- The pair could start a fresh increase if it clears the $152 resistance zone.
Solana Price Trims Gains
Solana price struggled to continue higher above $160 and started a fresh decline, like Bitcoin and Ethereum. SOL declined below the $155 and $152 support levels.
It even dipped below $150 and tested the $145 zone. A low was formed at $144 and the price is now correcting some losses. There was a move above the 23.6% Fib retracement level of the downward move from the $160 swing high to the $144 low.
Besides, there was a break above a key bearish trend line with resistance at $147 on the hourly chart of the SOL/USD pair. Solana is now trading below $150 and the 100-hourly simple moving average.
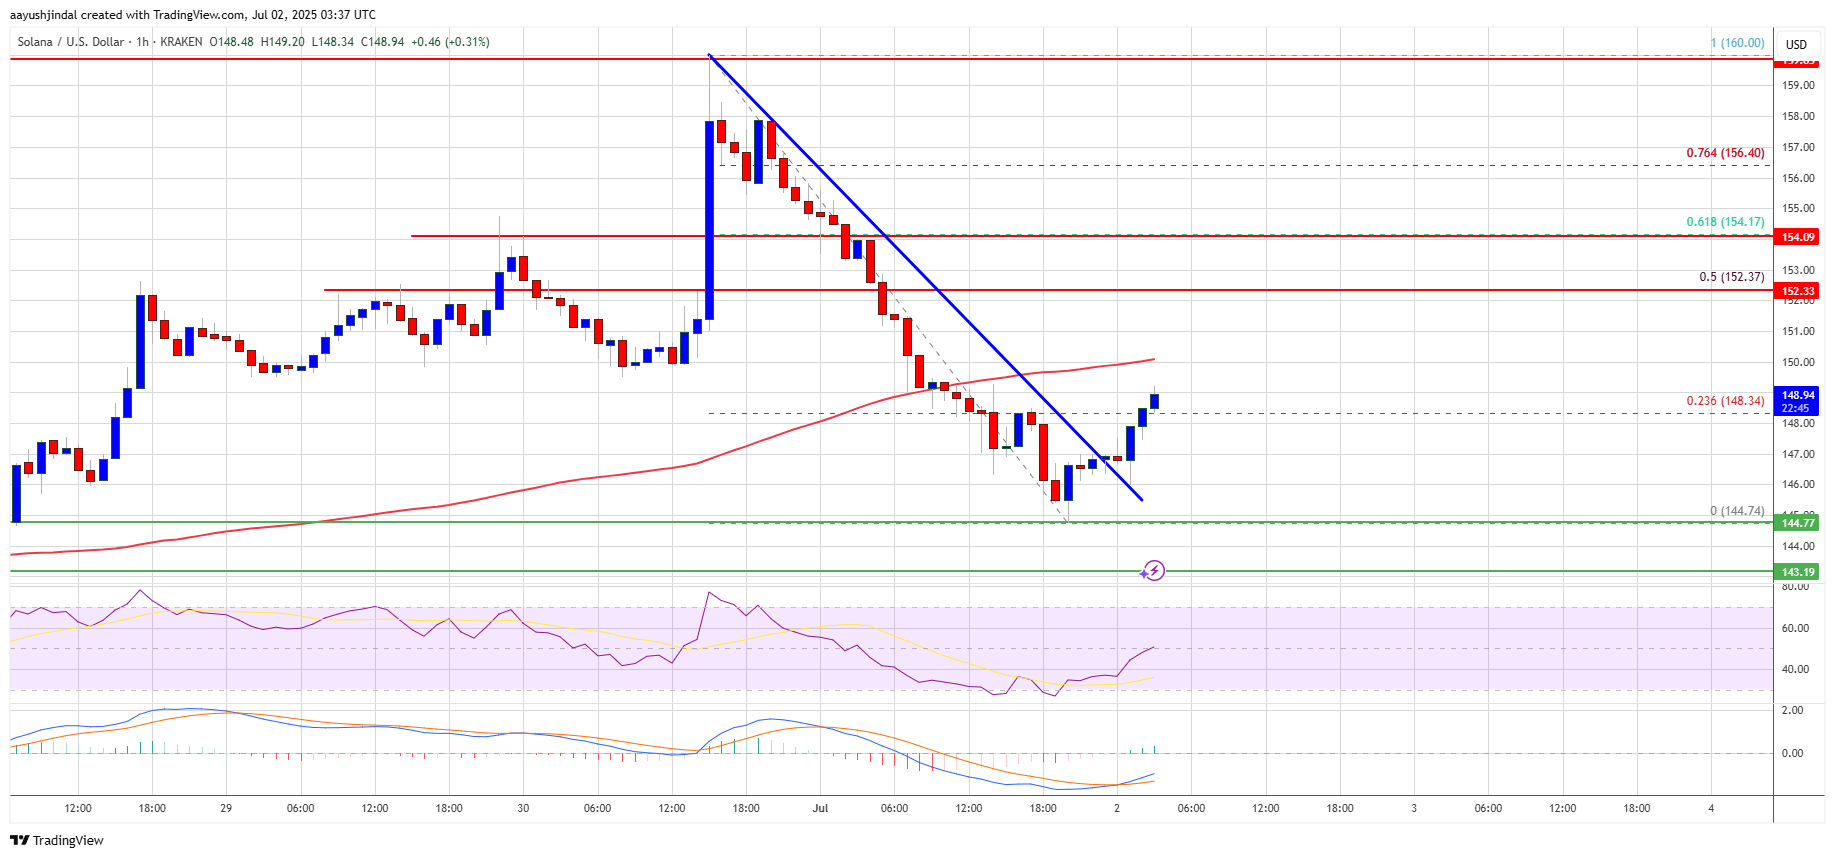
On the upside, the price is facing resistance near the $150 level. The next major resistance is near the $152 level. It is close to the 50% Fib retracement level of the downward move from the $160 swing high to the $144 low. The main resistance could be $155. A successful close above the $155 resistance zone could set the pace for another steady increase. The next key resistance is $160. Any more gains might send the price toward the $165 level.
Another Decline in SOL?
If SOL fails to rise above the $150 resistance, it could start another decline. Initial support on the downside is near the $145 zone. The first major support is near the $142 level.
A break below the $142 level might send the price toward the $136 zone. If there is a close below the $136 support, the price could decline toward the $125 support in the near term.
Technical Indicators
Hourly MACD – The MACD for SOL/USD is losing pace in the bearish zone.
Hourly Hours RSI (Relative Strength Index) – The RSI for SOL/USD is above the 50 level.
Major Support Levels – $145 and $142.
Major Resistance Levels – $152 and $155.